In the realm of statistical analysis and empirical research, the notion of uncertainty pervades, prompting the need for a robust method to quantify and communicate the range of possible values around an estimated parameter. A confidence interval is an estimate in statistics drawn from a sample population to evaluate the overall population value. In this article, we will delve into its theoretical underpinnings, construction methodologies, and practical applications.
Definition: Confidence interval
Confidence in statistics refers to probability. The confidence interval refers to the average of your estimate in statistics, including the negative or positive variations. The desired confidence is usually one minus the alpha value applied in the statistical test: (1 − a).
When do you use a confidence interval?
You use confidence intervals for diverse statistical estimates like proportions, population means, and variations between population means and proportions. The confidence interval helps to communicate the difference surrounding the point estimate.

Calculating a confidence interval
There are certain aspects a student needs to consider before calculating the confidence interval. These include:
- The point of estimate
- Critical values used in the statistic test
- The standard deviation of the sample
- The sample size
Point estimate
The point estimate refers to the statistical estimate the student makes.
Critical value
The critical value guides the students on the number of standard deviations they need to achieve their desired confidence level for the confidence interval.
- Choose the alpha value:
The alpha value refers to the probability verge for statistical importance. The most used alpha value is p=0.05, but you can use 0.1, 0.01, or 0.001. - Decide between one-tailed and two-tailed:
In the case of the two-tailed interval, you should divide the alpha value by two to get the alpha values of the higher and lower tails. - Find the corresponding critical value:
For normal distribution or when the sample size is larger than thirty, you can use the z-distribution to find the critical values.
Here are some of the common values used for z statistics:
| Confidence Level: | 90%, 95%, 99% |
| Alpha for one-tailed CI: | 0.1, 0.05, 0.01 |
| Alpha for two-tailed CI: | 0.05, 0.025, 0.005 |
| Z statistic: | 1.64, 1.96, 2.57 |
A student should use a t distribution in the case of small datasets with normal distribution.
Standard deviation
The student should find the data’s sample variance and then perform a square root to get the standard deviation.
1. Find sample variance
You can find the sample variance by adding the squared differences from the average, also referred to as mean-squared-error (MSE).
= Sample variance
= The value of the one observation
= The mean value of all observation
=The number of observations
2. Square root sample variance
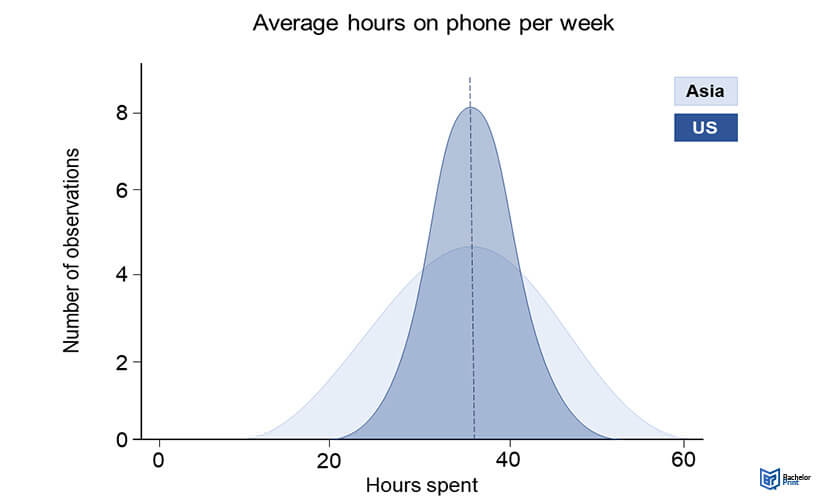
In the example above, the variance in the Asian estimate is 100, while the variance in the US estimate is 25. The square roots are 10 and 5, respectively.
Sample size
The sample size refers to the total observations in a data set. In the above survey, the sample size is 100 Americans and 100 Asians.
- ✓ Free express delivery
- ✓ Individual embossing
- ✓ Selection of high-quality bindings
Confidence interval in normal distribution
The confidence interval in this case is:
= The population mean
= The critical value of the z distribution
= The population standard deviation
= The square root of the sample size
In the case of a t distribution, use the same formula but replace Z* with t*.
Confidence interval for proportions
You should use the same formula for proportions, but the SD, in this case, equates to the same proportion multiplied by one subtracting the proportion.
= Proportion of the sample
= Critical value of z distribution
= Sample size
Confidence interval in non-normal distribution
There are two methods that you can use to calculate the confidence interval for data with a non-normal distribution:
1. Find a distribution that matches the shape of your data
Apply this distribution to get the confidence interval
2. Data transformation to make it fit a normal distribution
Perform a reverse transformation on data, then calculate the maximum and minimum bounds of the confidence interval.
Reporting the confidence interval
When reporting the confidence interval in papers, include the higher and lower bounds of the confidence level.
They are used in graphs when demonstrating variations between groups, variations around estimates, and creating a linear regression.

Common misinterpretation of the confidence interval
A common misinterpretation is that the real value of one’s estimate is between the higher and lower range of the confidence interval. This is false, as the CI is calculated using a sample rather than an entire population.
FAQs
To determine how good an estimate is. The higher the CI, the more caution you should take.
The number of observations in a statistical sample.
The square root of sample variance.
