Descriptive Statistics – Definition & Types

03.10.22 Descriptive statistics Time to read: 5min

How do you like this article?

0 Reviews


Descriptive-statistics-Definition

Gathering data is a critical component of qualitative research. Once the data is collected, a statistical interpretation is required to outline the distinct features of the responses. This is where descriptive statistics, a vital branch of statistics, comes into play. This methodology offers a detailed summary and interpretation of the data, using measures such as mean, median, mode, and standard deviation to provide insights about the sample.

Descriptive Statistics – In a Nutshell

  • Descriptive statistics aims to describe a set of raw data from the responses in a study using summary statistics, graphs, or tables.
  • Unlike inferential statistics, descriptive statistics are not used to draw inferences from the responses in a study.
  • These statistics help you understand a data set better and faster.

Descriptive statistics

Descriptive statistics is the analysis of data in qualitative research. For example, descriptive statistics summarizes the sample data using charts, tables, or graphs. Also, various techniques like mean calculations describe the relationship between two or more variables. Therefore, descriptive statistics helps researchers understand the data better.

Give your thesis a final format revision prior to printing
Have a last check of your formatting with our 3D preview feature before sending your thesis to print. The accurate virtual representation of what the physical print will look like, affords you to ensure the printed version aligns with your expectations.

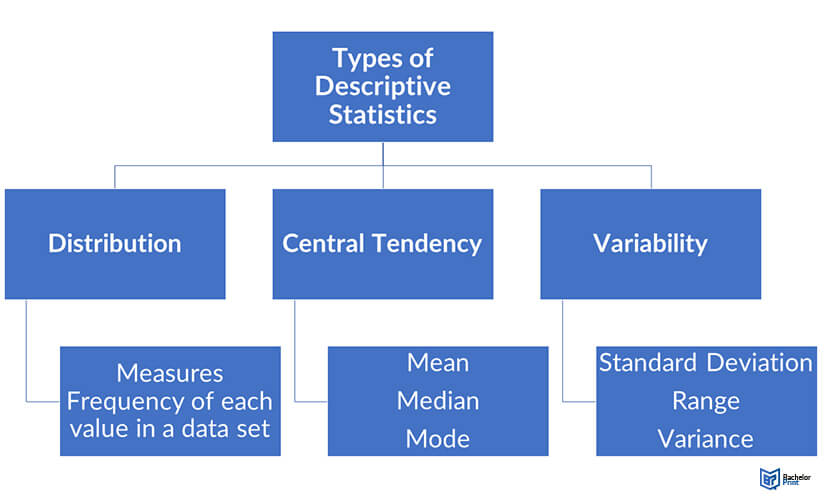
Types of descriptive statistics

There are three primary types of descriptive statistics:

  • Distribution – This type focuses on the frequency of each value in a data set.
  • Central tendency – This one focuses on the averages of the values.
  • Variability/dispersion – This one focuses on how the values spread out.

In univariate analysis, you can use these three types of descriptive statistics to assess one variable at a time. However, in bivariate or multivariate analysis, you can use them to compare two or more variables.

Example

In a study focusing on the popularity of different music genres by gender, you can describe a survey where participants indicate how many hours they listen to different genres.

  • Hip hop
  • Blues
  • RnB
  • Rock

With the collection of survey responses, you can use descriptive statistics to find the frequency at which participants listen to each genre (distribution), the averages of each genre (central tendency), and the spread of responses of each genre (variability).
Descriptive-statistics-types

Frequency distribution

A typical data set features a distribution of values. You can use a table or graph to summarize the frequency of each variable in figures or ratios (percentages).

For the gender variable in our example above, list all possible answers in the left column and calculate the percentages of the responses in the right column.

Gender Number
Male 182
Female 235
Other 27

The table shows that more women took part in the study.

Example

Grouped frequency distribution example of the same study:

Here, group the numerical responses and add them up for each group, then convert them into percentages.

Time spent listening to hip hop in the past week (in hours) Percentage
0-2 10%
2-4 6%
4+ 5%

Here, you can see that most people listened to hip hop for 0-2 hours in the past week.

Measures of central tendency

Here, you estimate the center or average of a data set using mean, median, or mode computations.

Example (Mean)

The formula for calculating the mean is the sum of the values in the responses divided by the number of responses. In our sample, the mean can be calculated as follows.

  • The number of hours listening to hip hop data set: 2, 1, 5, 1, 7
  • Sum = 16
  • No of responses: 5
  • Mean = 16/5 = 3.2

Example (Median)

The median is the number in the middle of the data set. For instance, in our data set (see sample above), the middle number is 5. However, if there are two middle numbers, you can find their sum and divide it by 2.

Example (Mode)

The mode is the most popular response value. So, in our sample data set, the mode is 1 because it appears twice.

Measure of variability

The measure of variability gives you a sense of how spread out the response values in your data set is. So, you can use standard deviation, range, and variance to reflect various aspects of the spread.

Range

The range gives you an overview of how far apart the most extreme response values are. Therefore, you can calculate the range by subtracting the lowest from the highest values.

Example

  • Data set (in order from smallest): 1,1,2,5,7
  • Range: 7-1 = 6

Standard deviation

The (s) is the average amount of variability in your data set. Therefore, it shows you how far each response is from the mean. Normally, the larger the deviation, the more variable the data set is. You can calculate the standard deviation by following the steps below:

  1. List all the values and find their mean
  2. Subtract the mean from each value to find the deviation
  3. Square the deviations for each value
  4. Find the sum of the squared deviations
  5. Divide the sum of the squared deviations by (N-1) (N is the number of responses)
  6. Find the square root of the final figure

Example

  1. Raw data Deviation Deviation (squared)
    2 2-3.2 = -1.2 1.44
    1 1-3.2 = -2.3 5.29
    5 5-3.2 = 1.8 3.24
    1 1-3.2 = -2.3 5.29
    7 7-3.2 = 3.8 14.44
  2. M= 3.2
  3. Sum of deviation = -0.2
  4. Sum of squares of deviation = 29.7
  5. 29.7/ (5-1) = 7.425
  6. Square root of 7.425 = 2.725

Therefore, the standard deviation is 2.725. So, on average, each score deviates from the mean by 2.725.

Variance

This is the average of the squared deviations from the mean. It reflects the degree of spread in the data set. Therefore, the higher the variance, the more the spread of the values in the data set.

Example

  • Data set: 2,1,5,1,7
  • S = 2.725
  • S2 = 7.425

Descriptive statistics vs. inferential statistics

The difference between descriptive statistics and inferential statistics lies in their function and methodology. For instance, descriptive statistics use summary statistics, tables, and graphs to describe the values in a data set. Therefore, it helps a researcher understand the dataset easily and quickly.

On the other hand, inferential statistics uses a small sample of data to draw deductions or inferences about a larger population from which the sample is collected. For example, inferential statistics helps researchers understand the political preferences of millions of people in a region.

Descriptive statistics example

Example 1

A good example of descriptive statistics is the data collected for COVID-19 acceptance in Canada. The study features a sample size of 1500 vaccinated individuals. The interpretation of the study highlights that the most common reasons the participants accepted the vaccinations are:

  • Fear of infection
  • Desire to protect the elderly and kids
  • Influence from public figures
  • Workplace requirement
  • Travel requirement

Example 2

The student’s grade point average (GPA) is a good example of descriptive statistics. A GPA usually takes data points created through a series of tests and assessments, then finds their average. Therefore, the average presents a general overview of a student’s mean academic performance.


FAQs

Descriptive statistics is a data analysis technique that describes, shows, and summarizes the basic characteristics of data sets in a specific study.

Inferential statistics helps draw a conclusion about a large sample using the data collected. In contrast, descriptive statistics only describes and summarizes the collected data.

Descriptive statistics can be broken down into two major categories: dispersion and central tendency measures.

The three types are distribution, measures of central tendency, and measures of variability.

Print Your Thesis Now
Printing your thesis with BachelorPrint guarantees every Australian student to benefit from numerous advantages:
  • ✓ Free express delivery
  • ✓ Individual embossing
  • ✓ Selection of high-quality bindings

configure now


From

Salome Stolle

How do you like this article?

0 Reviews
 
About the author

Salome Stolle works as the brand manager for the English market at BachelorPrint. Throughout her 12-year residency in Denmark, she completed her International baccalaureate and Master’s in Culture, Communication, and Globalization with a specialization in media and market consumption. Through this experience, she has gained advanced competencies in academic writing and a high proficiency level in the English language. With her passion for writing, she does not only deliver well-written content but also strives to adjust to the students’ demands.

Show all articles from this author
About
BachelorPrint | #1 Online Printing Service
For Australian Students

BachelorPrint is an online printing service specialised in printing and binding academic papers, theses, and dissertations. Offering a wide arrange of bindings and configurations, BachelorPrint aims to enable every Australian student to receive its desired binding. Additionally, BachelorPrint offers hundreds of educational articles on various topics regarding academic writing in its Study Guide, supporting students with writing their thesis or dissertation.


Our posts on other topics