The standard normal distribution is a mathematical term that relates to a special type of normal distribution.
In this article, you will discover what standard normal distribution is, when to use it, and how to calculate it.
Definition: Standard normal distribution
A standard normal distribution must be centred at zero, its mean average. Furthermore, the degree to which a given measurement deviates from zero must be expressed by standard deviation.
Standard normal distribution should not be confused with normal distribution, which is merely one type.
Calculation of the standard normal distribution
The standard normal distribution is calculated from a normal distribution.
To do this, its values need to be converted into scores that relate to how many standard deviations they are away from the mean.
Consequently, converting the values of a normal distribution allows statisticians to demonstrate the probability of certain values occurring.
In turn, this allows for a convenient method to compare different data sets.
The formula to use is:
| Formula | Explanation |
| z | z-score |
| x | Value (or x-score) |
| μ | Mean average of the set |
| σ | Standard deviation |
Some online calculators will produce z-scores for you if you enter all of your x values into it which can save time. To do it manually:
- Subtract the mean value from the data value.
- Divide this figure by the standard deviation.
Normal distribution vs. standard normal distribution
Both normal distributions and standard normal distributions form distinctively symmetrical bell curves.
That said, they differ because in standard normal distributions:
- The mean will always be zero.
- The standard deviation will always be fixed.
This means standard normal distributions get around the problem of differences with normal distributions that prevent them from being compared with one another simply.
There are five types of normal distribution, including standard normal distributions, that can be made clearer by standardizing them.
| Curve Type | Mean | Standard Deviation |
| Standard | 0 | 1 |
| Shifted to the right | Greater than 0 | 1 |
| Shifted to the left | Lesser than 0 | 1 |
| Stretched | 0 | Greater than 1 |
| Squeezed | 0 | Less than 1 |
Standardizing a normal distribution
Standardizing a normal distribution means working out how far values in a set of normally distributed data deviate from the mean in units of standard deviation.
Therefore, in the example above, it is not how much a particular shoe size value deviates from the mean but by how many standard deviations it differs from the mean. By converting values in a set of data to z-scores, normalizes different data sets.
Because the mean average will always be zero in a standardized normal distribution:
- An x-value greater than the mean will result in a positive z-score.
- An x-value less than the mean will result in a negative z-score.
- An x-value that is equal to the mean will result in a z-score of zero.
Calculation of the z-score
To convert a value into a z-score, use:
Then:
- Subtract the mean from the value.
- Divide this figure by the standard deviation.
| Curve Type | Mean | Standard Deviation |
| Standard | 0 | 1 |
| Shifted to the right | Greater than 0 | 1 |
| Shifted to the left | Lesser than 0 | 1 |
| Stretched | 0 | Greater than 1 |
| Squeezed | 0 | Less than 1 |
Standard normal distribution and probability
The standard normal distribution is used to describe the probability distribution. The area under the bell curve of a standardized normal distribution covers all probabilities.
For each z-score, the bell curve can be split into two sections.
If the z-score were 0 – the mean figure – for example, then there would be an equal probability on either side of the line. The area formed to the right of it represents the probability of a certain outcome. This area is called a p-value.
Z-tests and p-values
A z-test is used to contrast the mean values of two sample sets. It can also be used to compare a mean value against all the data in a sample. This helps statisticians to establish how representative their data may be.
A high z-score should result in a relatively low p-value unless there was a problem with the original data values. A p-value that is less than 5% usually means there is a value of statistical significance, something that hasn’t necessarily arisen by sheer chance.
Using a z-table
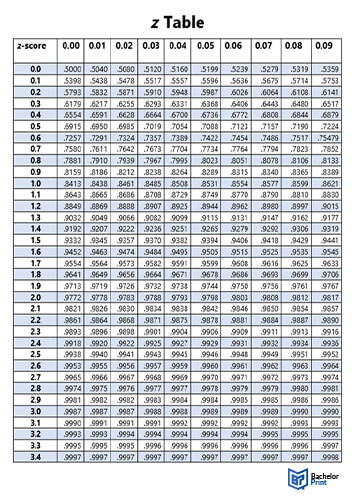
Statisticians use z-tables to help them establish a given area under a section of a bell curve. The approximate p-values are based on the digits of a particular z-score you want to check.
Use one to work out a p-value, the area under the bell curve to the right of the z-score, and hence the probability of that z-score.
- Look down the left-hand column for the first two digits of the z-score in question.
- Next, look along the top row for the corresponding third digit of the z-score.
- Where the chosen column and row intersect, this is where you’ll find your approximated p-value.
Step-by-step calculation of the standard normal distribution
Let’s take a new example to demonstrate all the steps outlined above.
Step 1: Calculation of a z-score
Let’s say you have a test score of 65 when the mean average was 80 and the standard deviation was 15.
| Formula | Explanation | Calculation |
In this case, a z-score of -1 indicates the test score value in question is one standard deviation less than the test average.
Step 2: Finding the p-value
To find a p-value from a z-score, use a table.
In this example, the p-value is 0.0630 (or 6.3%) because the z-score is -1.53. The p-value has been found by locating the row that corresponds with -1.5 and the column that corresponds with 0.03.

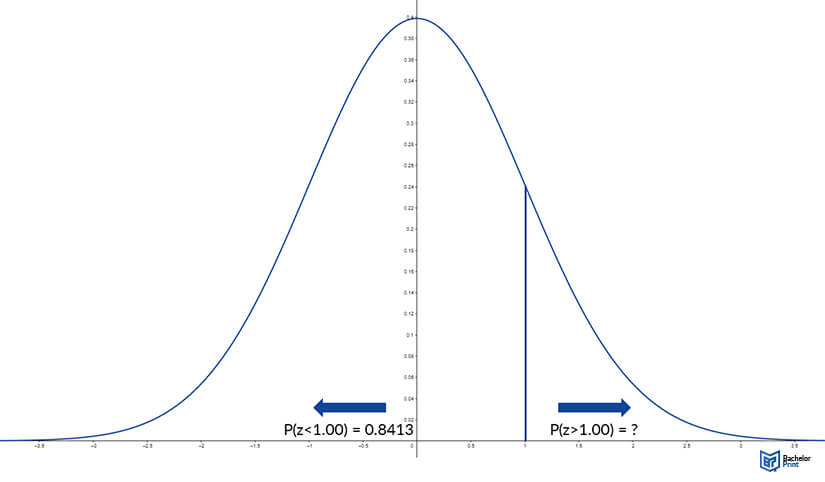
In the above example of a standard normal distribution bell curve, the z-score indicated is 1.
Using a z-table in the way described, it is possible to establish the area under the curve to the right of the line that indicates the z-score would be 0.1587 (or 15.87%) of the total.
In other words, the probability of a value in the sample returning a z-score of 1 would be 0.1587.
- ✓ Free express delivery
- ✓ Individual embossing
- ✓ Selection of high-quality bindings
FAQs
A standard normal distributed is a normal distribution that has been standardized to reflect how much values differ from the average according to the sample’s standard deviation.
A standard normal distribution is helpful for assessing data and comparing more than one set of samples together.
In a standard normal distribution, an x-score relates to the value of a sample. These are standardized into z-scores.
Yes, a z-distribution and a standard normal distribution are two terms that mean the same thing.

