In statistics, there are many variables and measures to use on the data you have collected. Depending on what you want to achieve, it is necessary to select the right one for your study. Quantiles are a rather simple but effective way to determine different sectors in your distribution by calculating subgroups of different percentages. The following article will give you an overview of different types of quantiles and explain these with examples.
Definition: Quantiles
Quantiles, which are sometimes also called fractiles, are equal-sized subgroups of a sample including a certain percentage of the values. Mathematically, quantiles are often shown as Qp, qp, or x(p) with p being the percentage of the quantile. There is always one quantile less than the groups you divide it into. Each quantile describes the point in the dataset, where p% of the values lie below. Quantiles are only used with continuous variables.
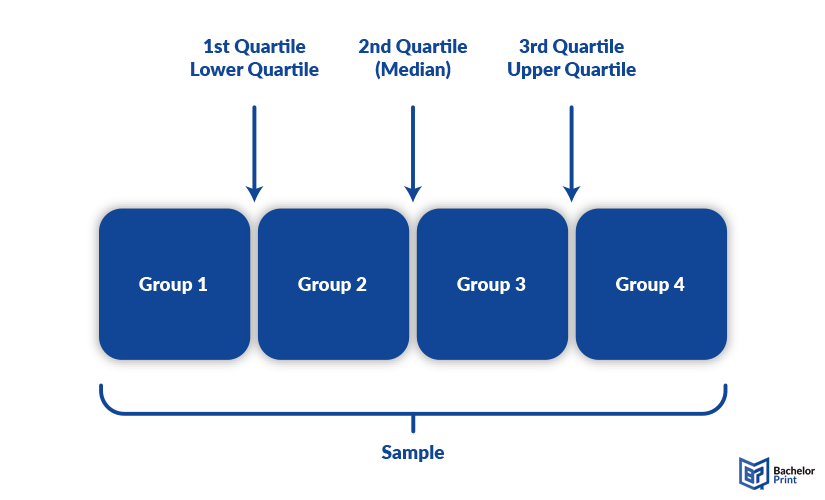
As the example image shows, quantiles divide a group into four subgroups, creating three quartiles: the lower one, the upper one and the middle one, also called median.

numerous advantages for Canadian students:
- ✓ 3D live preview of your configuration
- ✓ Free express delivery for every order
- ✓ High-quality bindings with individual embossing

Calculation
To calculate any quantile, you can simply follow these steps:

Determine the number of values in your sample (n). If you want to determine a certain number of groups, you need to have more values than groups. If you merely need a certain percentage of participants, the number is not as important anymore.

Arrange your values in ascending order and number them.
Do not confuse values and numbers here. The values are the results of your study, for example the heights of participants. Numbers, on the other hand, are assigned in ascending order to the values. (For example: (1) 160 cm; (2) 174 cm; (3) 182 cm)

Define the percentage of quantile you need (p). Take into consideration, that there should always be more participants than groups you will divide them into.

Calculate the spot in the dataset by using the formula n×p
If the outcome is not integer, round the number up, no matter how small the decimal is. If the outcome is an integer, you will use the mean of the values in places (n×p) and (n×p)+1.

Now determine the value of the quantile. Therefore, you will use the outcome of step 4. If your outcome was not an integer, and you rounded it up, the value of the quantile is in the place with that number. In case your outcome was an integer, you will calculate the mean of the values in the places (n×p) and (n×p)+1.
Types of quantiles
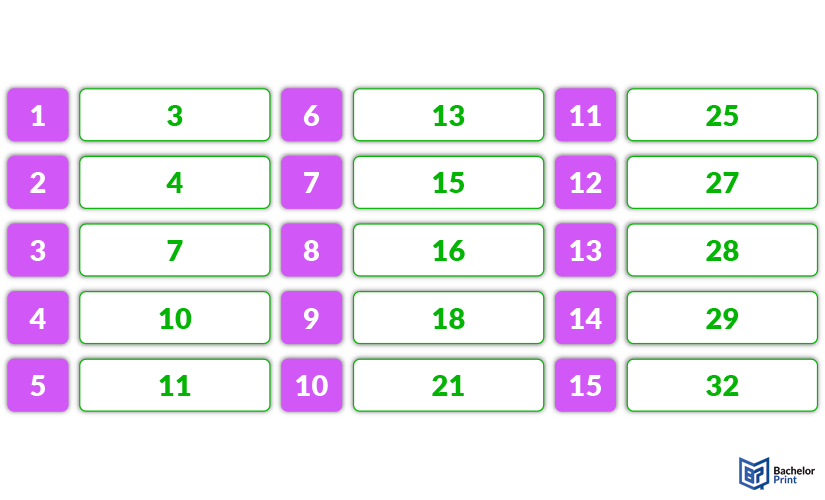
Quantiles can come in any size you need them. However, since some of them are used frequently, they have earned specific names. When calculating, keep in mind the difference between numbers and values. The following section will briefly explain each of the quantiles, using this dataset as an example:

Tertiles
Tertiles divide a dataset into three groups, meaning there are two tertiles. Each group includes ~33% of the entire sample.
Quartiles
Quartiles are the most used type of quantile, dividing the sample into four groups of each 25%. The three different quartiles are referred to as the lower/first quartile Q1, the middle quartile or median Q2 and the upper/third quartile Q3.
Interquartile range (IQR)
The interquartile range, often shortened to IQR, defines the middle 50% of a distribution. It is calculated by subtracting the first quartile from the second quartile.
Quintiles
Quintiles divide the dataset into five groups, meaning there are four quintiles. Each group includes 20% of the entire sample.
Deciles
Deciles divide the dataset into ten groups, meaning there are nine deciles. Each group includes 10% of the entire sample.
Percentiles
Percentiles divide the dataset into 100 groups, meaning there are 99 percentiles. Each group includes 1% of the sample. Our example dataset is too small for these quantiles, but by now you should know how the mechanism works. So, if you find yourself in a situation, where you will have to use percentiles, it should be rather simple.
Other quantiles
If your research requires a 35% quantile or a 96% quantile for whatever reason, you can always adjust them to your needs. The formerly named quantiles are merely specific ones that have been given names, but in reality, simply choose the percentage you require for your study.
Outlier effect
Outliers are values in a dataset that pose extremes, either above or below the rest. They can greatly influence the skewness of a distribution or certain statistical measurements. However, quantiles are usually not influenced by outliers, since they are calculated by the number of values not the values themselves.
Only if there is a group of outliers at one end of the distribution, it should be taken into closer consideration (for example, if your dataset includes the values 1,2,3,4,5,6,7,33,34,35). Then, on the other hand, it is also questionable whether these numbers can be referred to as outlier or whether they are simply describing a widely spread distribution.
FAQs
“Quantiles” is the umbrella term for fractions of a certain percentage of a sample. Quartiles, on the other hand, are one type of quantile, which divides a sample into four groups.
Quantiles are calculated by the formula n*p, where n is the number of values and p is the percentage of the quantile. If the outcome is not an integer, you adjust the number upwards and then find the value at that place as your quantile. If the number is an integer, you calculate the mean of this one and the next one to find the quantile.
While any percentage can be used for quantiles, there are a few specific ones that have been given names: tertiles (1/3), quartiles (25%), quintiles (20%), deciles (10%) and percentiles (1%).
Quantiles define the point in a dataset, where a certain percentage of values lies below. Therefore, they show how skewed a distribution is. For example, if the upper quartile is closer to the median than the lower quartile, it means that the distribution is positively skewed.
