Organizations need to frequently find new ways to enhance their sales volumes and profits and reach new customers. There are several strategic options available for an organization to achieve this, such as opening up to new markets or developing new products. However, choosing the most suitable methodology can be challenging. The Ansoff matrix helps businesses and marketers evaluate the possible dangers associated with each strategy and create the appropriate improvement plan.
Definition: Ansoff matrix
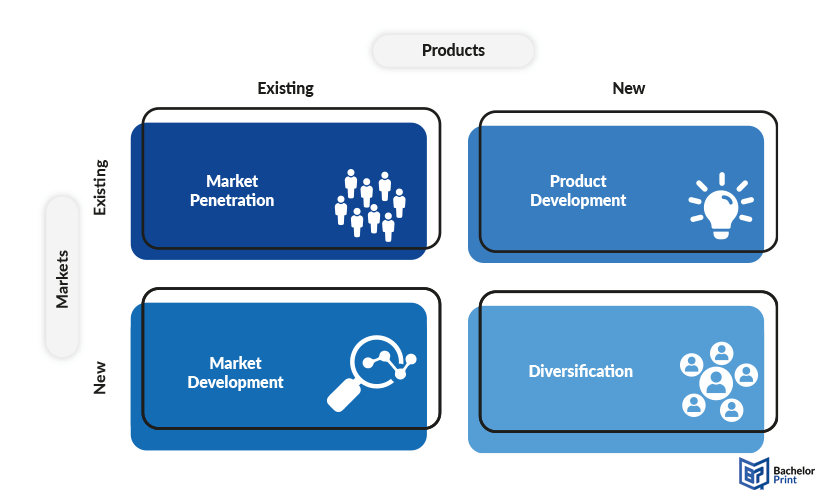
The mathematician and business manager Igor Ansoff established the Ansoff matrix and initially published it in the 1957 Harvard Business Review. The Ansoff matrix gives a practical and straightforward approach to product and market development strategy. It explores growth opportunities via existing and new products, as well as new and existing market segments. The nsoff matrix outlines four sectors of potential growth whose levels of risk vary. Those areas are market penetration, product development, market development, and diversification.

Understanding the Ansoff matrix
Ansoff proposed that the two most important factors when developing a growth strategy are product growth and market growth. The four strategies of the Ansoff matrix are illustrated in the table below.
| Strategy | Risk level | Definition | Relevant information |
| Market penetration | Low | Selling more existing products in existing markets | Utilizes current market and product familiarity |
| Product development | Moderate | Developing new or improved products for existing markets | Innovation and may involve moderate investment |
| Market development | Moderate | Introducing existing products to new markets | Adapting products to new customer needs/areas |
| Diversification | High | Introducing new products into new markets | Involves highest level of risk and uncertainty |
However, if you want a more thorough explanation, refer to the sections below.
The market penetration strategy is the first and most used of the Ansoff Matrix strategies. Its basic aim is to expand the market share. This strategy entails increasing market share within existing market segments and attracting new markets with an already existing product. At this level, the company strives to increase its product sales to both new, existing and competitors’ customers. Despite its relatively low risk, the market strategy also has minimal growth opportunities.
Techniques for the market penetration strategy include:
- Lowering prices
- Increasing marketing efforts
- Refining the product to attract more customers
- Enhancing service offerings
Product development occurs when a new product is presented to markets and customers that are already in place. For instance, when substituting existing products or expanding the variety of products. Here you might choose to extend your product by producing different types or repackaging the existing ones. Alternatively, you can develop related products or services. In the service industry, you might decide to improve the service quality or shorten your time in the market. It carries more risk than market penetration due to the uncertainties involved in developing new products and the investment required.
To successfully obtain these new products, you can use the following options:
- Allocating resources toward research and developing new products
- Obtaining the authorization to manufacture someone else’s product
- Purchasing products and rebranding them under one’s label
- Joint development of products, leveraging the firm’s distribution channels or brand recognition
The market development strategy involves venturing into new markets (new geographical boundaries, new target groups) with existing products. A few changes might apply to make the product more adaptable to the new markets. You can employ market segmentation to target various people with different demographic characteristics, different from your usual customers. Equally, you can utilize other sales avenues such as online sales and direct sales if you are currently using intermediaries.
You can do the following to venture into new markets:
- Establishing different customer segments
- Foreign markets
- New regions of areas of the domestic market
- Selling the product to businesses when it was previously only sold to individuals
This approach is more prone to success under the following conditions:
- The company possesses distinctive product technology that can be utilized in the new market
- Advantages from economies of scale if the output is increased
- The new market closely resembles the one where the company has expertise
- The buyers within the market inherently contribute to profitability
The diversification strategy is where companies bring new products into new market spaces. It is common among start-ups. Given its nature, this strategy has the maximum potential for growth and the highest risk of failure. It has two variants.
- Related diversification: The new products are somewhat related to the existing products, which might provide potential synergy because of common technology, markets, or processes.
- Unrelated diversification: The new products are entirely different from the current range. This strategy spreads risk across different markets and requires skills and knowledge.
Diversification can offer significant rewards if successful because it opens up entirely new revenue streams and allows the business not to rely on a single market fit. However, it also poses the highest risk due to entering unknown markets with unproven products.
Implementation
Using the Ansoff Matrix to assess the risks associated with various strategies is a simple procedure but can be time-consuming. It is advisable to complete at least a SWOT analysis and an external analysis such as Porter’s Five Forces and PESTEL Analysis before embarking on the Ansoff matrix. Given the significance of the business impact that these decisions have, one must use the correct analysis. Below are the three steps to follow when implementing the procedure.
Analysis
The analysis thoroughly examines internal and external factors that impact the business’s growth potential. Key elements of the analysis are:
- Market analysis is used to understand current market scenarios, including customer needs, competitor behaviour, and industry trends.
- Product analysis to evaluate strengths and weaknesses of existing products or services, and identify opportunities for innovation or expansion.
- SWOT analysis to assess the business’s strengths, weaknesses, opportunities, and threats to inform strategic decision-making.
- Resource analysis to examine the organization’s capabilities, including financial resources, human capital, and technology infrastructure.
This thorough analysis provides a foundation for informed decision-making by identifying growth opportunities, potential challenges, and areas where the business can leverage its strengths.
Managing risks
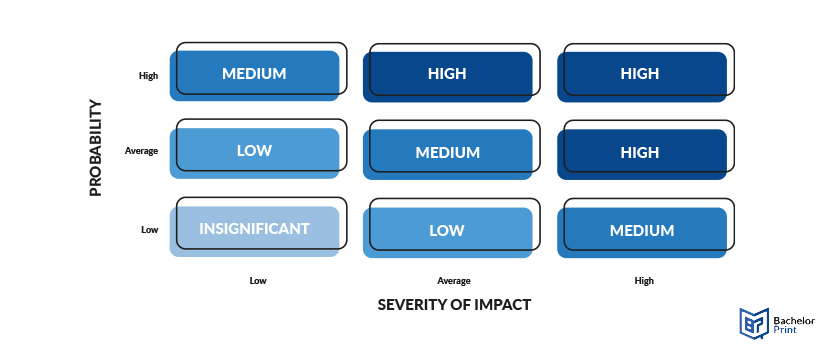
Managing risks involves identifying, assessing, and mitigating potential obstacles or uncertainties that may impact the successful implementation of growth strategies. This shows a clear picture of the potential risks of each strategic option. A risk impact/probability chart may help here. Key elements of the risk management are:
- Identify the risks of each strategy, including market volatility, competitive threats, etc.
- Evaluate the potential impact of identified risks on the business’s objectives and performance.
- Develop strategies to minimize and mitigate risks, such as diversification, insurance, etc.
- Monitor external and internal factors that pose risks to the business and adjust strategies accordingly.
Managing risks helps to safeguard the business against potential threats and uncertainties, ensuring that growth strategies are implemented effectively and sustainably. A risk impact/potential chart may look like this.

Strategy selection
Strategy selection involves choosing the most appropriate growth strategies based on the findings of the analysis and the organization’s risk tolerance and objectives. You can ascertain this by using the decision matrix analysis to evaluate various strategic options and pick the best. Key elements of the strategy selection are:
- Ensuring that selected strategies align with the organization’s long-term goals, vision, and values.
- Balancing the potential rewards of each strategy against the associated risks, considering the organization’s risk appetite and capacity.
- Assessing the availability of resources and capabilities required to implement each strategy effectively.
- Selecting strategies that allow for flexibility and adaptation in response to changing market conditions and emerging opportunities or threats.
Strategy selection aims to identify the most promising avenues for growth that leverage the organization’s strengths, mitigate potential risks, and align with its overall strategic direction.

- Each row represents a criterion (e.g., cost, compatibility, features, etc.).
- Each column represents an option being considered (e.g., Microsoft, Oracle, Salesforce, SAP).
- The ratings in each cell represent how well each option meets the corresponding criterion, on a scale from 1 to 5 (1 being poor, 5 being excellent).
- The “total score (weighted)” is calculated by summing up the products of the ratings and their respective weights (if applicable) for each option.
This decision matrix allows decision-makers to compare and evaluate different options based on multiple criteria simultaneously. In this example, Alternative A has the highest total score, indicating that it may be the most suitable choice based on the specified criteria. However, it’s important to note that the weights assigned to each criterion and the scores themselves should reflect the priorities and preferences of the decision-makers.
Ansoff matrix example
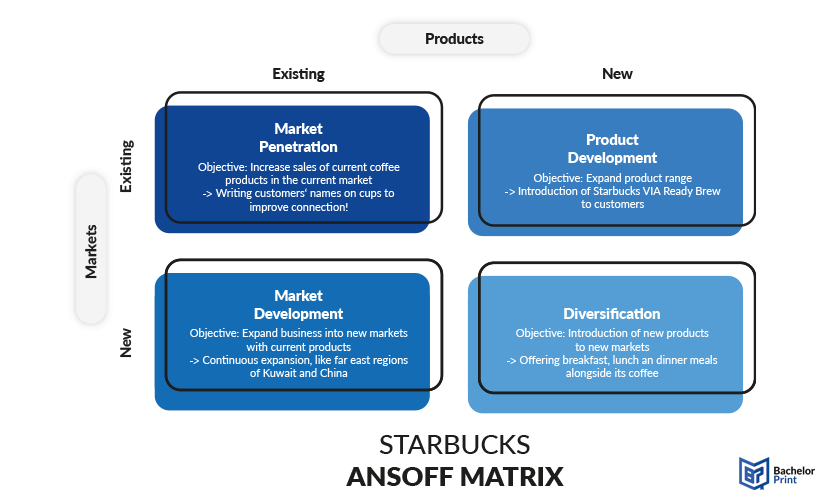
Starbucks Corporation, an American coffeehouse chain and coffee company, is an example of companies that have used the Ansoff Matrix to develop its growth strategy, as shown below.
The aim is to increase sales of their current coffee products in the current market. Starbucks is now writing consumers names on coffee cups to improve its relationship with customers.
The objective of this growth strategy is expanding Starbucks’ product range. Starbucks has implemented this by introducing Starbucks VIA Ready brew for its customers.
Here, the business aims at expanding into new markets with the current products. Starbucks operates globally and is continuously expanding to new markets. Its recent expansion saw it open operations in the Middle and the Far East regions of Kuwait and China.
The aim is to introduce new products to new markets. To implement this strategy, Starbucks should diversify itself in the food industry. Breakfast, lunch, and dinner meals can be offered alongside coffee.
This is the representation of the example in matrix form:

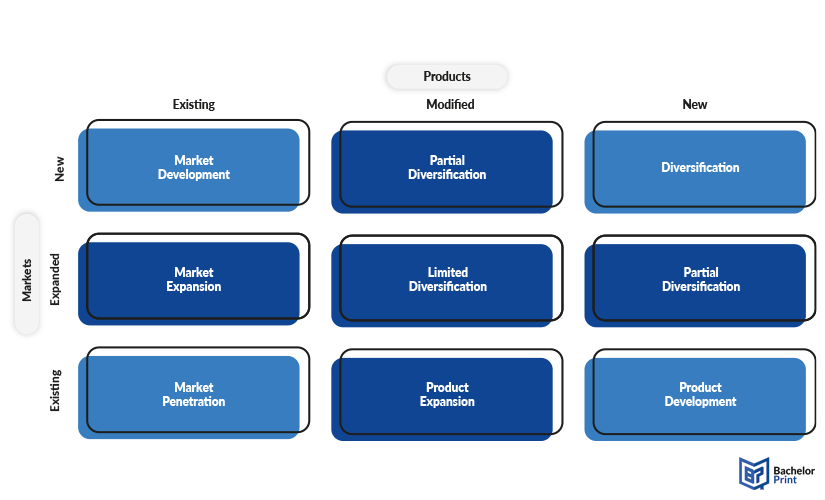
Nine-box Ansoff matrix
The nine-box Ansoff matrix is an extended version of the normal four-box matrix. It gives marketers an increased degree of sophistication by adding a twist to the concept. It has an addition of “modified products” and “expanded markets.”
Modified products come between existing and new ones, whereas expanded markets are placed between existing markets and new ones. Therefore, it shows the distinction between product extension and product development and the difference between market expansion and entry into absolutely new markets.

Criticisms
While the Ansoff Matrix is a widely used strategic tool, it has also faced criticism over the years. Some common criticisms of the Ansoff matrix include:
- Oversimplification
- Static framework
- Limited strategic guidance
- Assumption of market growth
- Risk ignorance
- Lack of focus on customer needs
FAQs
The Ansoff matrix is a strategic tool used by businesses to plan and assess growth strategies. It consists of four quadrants that offer different approaches to grow revenue, which are explained in detail above. Each quadrant helps companies decide how to expand or adapt their market and product offerings.
The four quadrants of the Ansoff matrix are:
- Market penetration: Increasing sales of existing products in existing markets.
- Market development: Introducing existing products into new markets.
- Product development: Developing new products for existing markets.
- Diversification: Introducing new products into new markets.
The Ansoff matrix is used by business executives, strategists, and managers to plan and assess their company’s strategies for growth. The Ansoff matrix is particularly useful for marketing and business development teams.
The Ansoff matrix and the BCG matrix are both tools used for strategic planning but serve different purposes:
- Ansoff matrix focuses on growth strategies by exploring product and market combinations.
- BCG matrix helps businesses prioritize their product portfolio based on market growth rate and market share, categorizing products into four types: Stars, Question Marks, Cash Cows, and Dogs.
