Independent variables are a profound topic within research methodology. They are foundational tools for researchers, allowing them to manipulate and observe how they impact dependent variables. Prominently across science and statistics, independent variables are meticulously selected and defined in the process of designing research. This article provides a more profound insight and serves as a guide to ensuring a sound research methodology in your academic writing.
Definition: Independent variables
Independent variables in research can be altered or manipulated to offer insight into their influence on dependent variables. They are “independent,” as they are not affected or influenced by other variables in an experimental study. Essentially, they initiate a process, also referred to as the cause. On the other hand, dependent variables portray the outcome of interest or effect that is measured. This cause-and-effect relationship represents the foundation of an experimental design, where researchers can infer causality and gain an understanding of the dynamics between different variables.
We speak of a controlled experiment when only the independent variable is intentionally changed across various conditions and groups. All the other variables are kept stagnant to make sure that all the changes in the dependent variable can be directly attributed to the independent value being manipulated. In other words, researchers can differentiate between the impact of the independent variable and other potential confounding variables, ensuring clear insights into the cause-and-effect relationships.
Other names for independent variables are:
- Explanatory variables
- Predictor variables
- Right-hand-side variables
The following shows an example of an independent variable in a study that aims to determine the effect of sunlight on plant growth.
To isolate the independent variable, the researchers place groups of the same type of plant in different conditions, where only the amount of sunlight is varied. All the other variables stay constant and are not influenced. Over time, the plants will be measured to determine the effect on plant growth by different exposure to sunlight. Ultimately, a conclusion can be drawn about the impact of sunlight on plant growth, portraying the casual relationship between the independent and the dependent variable.
Types
Depending on their nature, context, and how they are manipulated, independent variables autumn into various variable types. Properly categorizing them is essential for designing research studies, conducting analyses, and interpreting results accurately. The following delves into the several types in which they can be categorized.
This independent variable type represents groups that participants belong to. They refer to qualitative input and typically don’t involve numeric labels or categories. Categorical variables can be further categorized into nominal variables and ordinal variables.
Nominal variables represent categories without any inherent order.
Ordinal variables represent structured and clear relationships between categories, where intervals between them are not necessarily equal.
These are quantitative variables and can represent an infinite number of values within a given range. They are measurable quantities and can be further divided into smaller parts.
These are also quantitative variables; however, they represent countable numbers of distinct values. They typically depict counts of items or occurrences.
This independent variable type is prominent in experimental research. Researchers actively alter or manipulate them to achieve different conditions for comparison.
These variables are also called subject variables and represent groups of participants with characteristics or inherent traits. Participant characteristics can’t be changed, and thus, these variables can’t be manipulated or altered.
Often seen across experiments where conditions can be tightly controlled, these are variables that are selected and manipulated by researchers to observe their effect on the dependent variables.
Dependent and independent variables
Identifying independent and dependent variables is crucial in conducting and designing experiments. In most cases, when there are independent variables, there are also dependent variables in studies. However, it is often difficult to distinguish dependent from independent variables, especially in a more complex study.
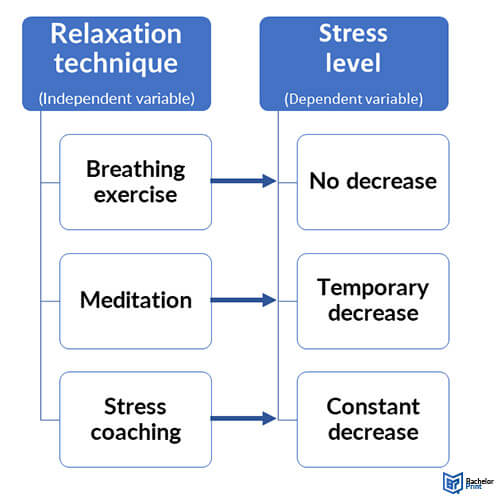
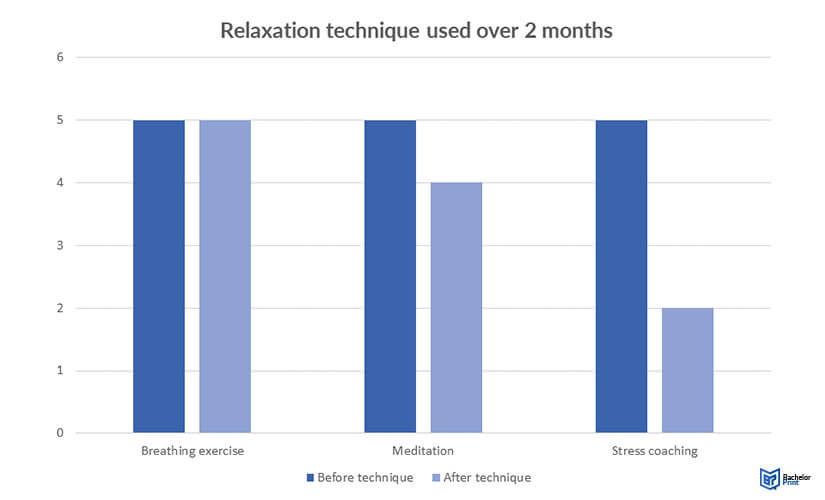
Dependent variables represent the quantities that a study measures, typically by manipulating, selecting, or observing the effect on them by independent variables. In a cause-and-effect relationship, they represent the effect or outcome of a study. Thus, it is typically called the output variable. The following example of dependent and independent variables gives a better insight.

When you work with categorical variables like in this example, it is useful to visualize it in a bar chart.

Differentiating between dependent and independent variables can be a tricky task, especially in a more complex study. The following table shows characteristics for each variable to make it easier to identify a dependent or an independent variable.
| Independent variable | Dependent variable |
|
|
In a more complex study, independent and dependent variables are often referred to by other terms. The table below provides an overview of antonyms.
| Independent variable | Dependent variable |
| Input variable | Output variable |
| Regressor variable | Regressed variable |
| Predictor variable | Predicted variable |
| Explanatory variable | Explained variable |
| Exogenous variable | Endogenous variable |
| Manipulated variable | Measured variable |
| Exposure variable | Outcome variable |
| Feature variable | Label/target variable |
Independent variables in statistics
In the realm of statistics, independent variables are a crucial part of linear regression analysis. In a linear regression model, the independent variable is also known as the predictor or explanatory variable, as it predicts or explains the dependent variable, also known as the response or outcome variable. The relationship between the independent and dependent variables is assumed to be linear, indicating that the changes in the results are expected to be proportional.
The regression equation formula is as follows:
Where,
= Dependent variable
= Independent variable
=
-intercept of the regression line
= Slope of the regression line
= Error term, variability in
that can’t be explained by the linear relationship with
.
Other types of variables
- categorical variables and qualitative variables
- quantitative variables and numerical variables
- nominal variables
- ordinal variables
- discrete variables
- continuous variables
- interval variables and ratio variables
- random variables
- latent variables
- composite variables
- binary variables
numerous advantages for Canadian students:
- ✓ 3D live preview of your configuration
- ✓ Free express delivery for every order
- ✓ High-quality bindings with individual embossing

FAQs
Independent variables can be varied and influence the dependent variable, giving different outcomes. In other words, dependent variables represent what happens as a result of the independent quantities.
In an experimental study, the independent variable is manipulated or varies to explore its effect on the dependent variable. It is called “independent” because it does not depend on any influence or impact by other variables in the study.
Some commonly used independent variables are:
- Time
- Space
- Density
- Mass
- Length
- Height
- Light exposure
An independent variable is a quantity in a study that is altered on purpose.
In a graph, the independent variable is typically visualized on the x-axis and the value determines the dependent variable, which is typically on the y-axis.