The coefficient of determination (R²) is a statistical measure that shows the proportion of variation in a dependent variable explained by an independent variable. It’s often used in linear regression to assess the relationship between two variables and how well the model can predict future outcomes.
Definition: Coefficient of determination
The coefficient of determination, often denoted as R², is a statistical measure representing the proportion of the variance in the dependent variable that is predictable from independent variables in a regression model. In simple linear regression, R² indicates the strength of the relationship between the independent and dependent variables.
The following table outlines what the statistical model predicts with different coefficients of determination:
| R² Value | Relationship | Interpretation |
| 0 | No relationship | Doesn’t explain any of the variations in the dependent variable |
| 0-0.2 | Weak relationship | Very little variation in the dependent variable |
| 0.2-0.4 | Moderate relationship | Explains some of the variations in the dependent variable |
| 0.4-0.6 | Strong relationship | Explains a strong part of the variation in the dependent variable |
| 0.6-0.8 | Very strong relationship | Explains a huge portion of the variation in the dependent variable |
| 0.8-1.0 | Perfect relationship | Explains all of the variations in the dependent variable |
The coefficient of determination
While the coefficient of determination is a statistical measure, it’s also used in linear regression to indicate the strength of the relationship between two variables.
Graphing linear regression data can provide a visual representation of the relationship between the independent and dependent variables, making it easier to interpret the strength and direction of the relationship.
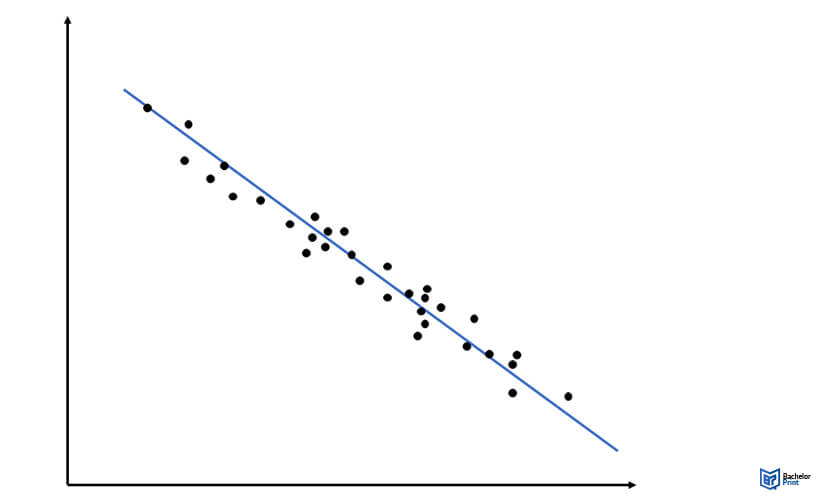
When R² is high, the data points on the graph will be closely aligned to the regression line, indicating a strong relationship. An example of a simulated graph when R² is high is shown below:

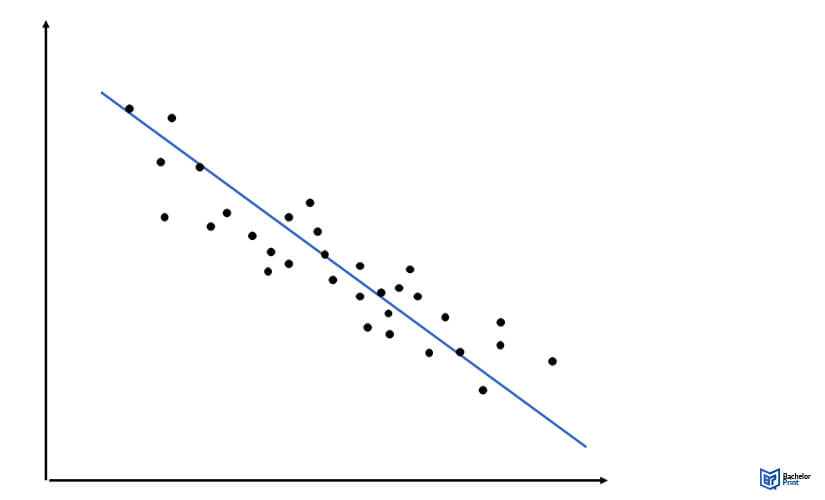
However, when R² is low, the data points on the graph will be widely dispersed around the regression line, indicating a weak relationship. An example of a simulated graph when R² is low is shown below:

In the graph, when R² is low, the data points are scattered around the line and not close to the line, showing that the independent variable doesn’t explain much of the dependent variable – indicating a weak relationship between the two variables.
Coefficient of determination: Calculation
The coefficient of determination (R²) can be calculated using different formulas depending on the type of statistical model. For simple linear regression models, it is calculated as the square of the correlation coefficient (r²).
For other types of statistical models, it can be calculated using the regression output, which includes the sum of squared residuals (RSS) and total sum of squares (TSS).
The correlation coefficient
The formula for the Pearson correlation coefficient (r) is:
If n equals the number of data points,
- Σ is the sum
- x is the independent variable
- y is the dependent variable
- xy is the product of x and y
- x2 is the square of x
- y2 is the square of y
- Σx is the sum of x
- Σy the sum of y
The regression output
In other types of statistical models, the coefficient of determination can be calculated using the regression output. The formula is:
Where:
RSS = sum of squared residuals
TSS = total sum of squares
Interpreting the coefficient of determination
The coefficient of determination, R², can be interpreted in several ways:
Model fit: R² can be used as a measure of how well a model fits the data. A higher R² value indicates a better fit, while a lower R² value indicates a lower fit.
The effect size: The coefficient of determination can be interpreted as an effect size. It can give an idea of the practical significance of the relationship between the independent and dependent variables.
Interpreting the coefficient of determination as an effect size
When interpreting the coefficient of determination as an effect size, it is good to refer to the rules of Jacob Cohen. According to Cohen, an R² value of 0.01 is considered a small effect size, an R² value of 0.06 is considered a medium effect size, and an R² value of 0.14 is considered a large effect size.
The following table provides a summary of Cohen’s rules for interpreting R² as an effect size:
| R² Value | Effect Size |
| 0.01 | Small |
| 0.06 | Medium |
| 0.14 | Large |
Suppose the R² value for a simple linear regression is 0.06. This would be considered a medium effect size, indicating that the independent variable explains a moderate proportion of the variation in the dependent variable.
numerous advantages for Canadian students:
- ✓ 3D live preview of your configuration
- ✓ Free express delivery for every order
- ✓ High-quality bindings with individual embossing

How to report the coefficient of determination
In a research paper, dissertation, or thesis, the coefficient of determination (r2) should be included in the results section, along with the correlation coefficient (r) and any other statistical results. It’s also good practice to report the R2 value with two decimal places and mention whether the coefficient of determination value is adjusted or unadjusted.
When reporting the coefficient of determination in an APA-style research paper, dissertation, or thesis, remember to present it clearly and concisely. The main considerations include:
- Clearly stating the R² value and its corresponding p-value in the results section
- Reporting the R² value in decimal format
- Noting whether the R² value is adjusted or unadjusted
- Interpreting the meaning and implications of the R² value in the discussion section
FAQs
The range of the coefficient of determination (R²) is between 0 and 1.
R² is calculated as the proportion of the variation in the dependent variable that is explained by the independent variable.
A high coefficient of determination (R²) value indicates a strong relationship between the independent and dependent variables, while low R² indicates a weak or no relationship.
