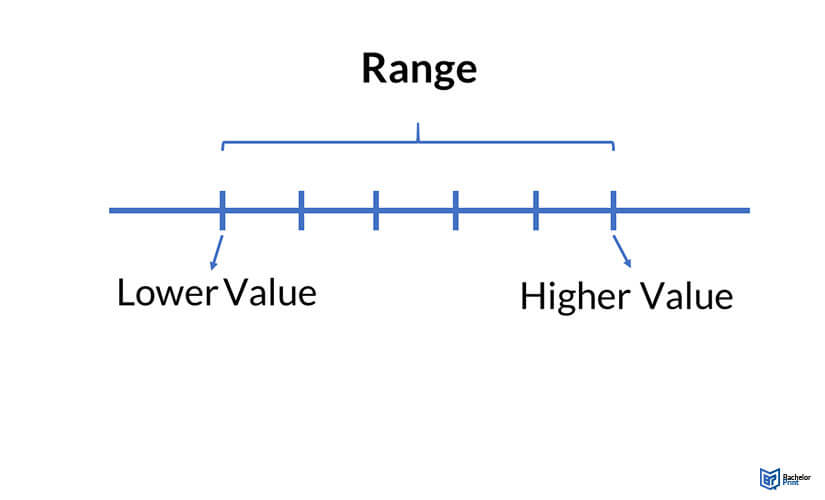
Researchers often interact with diverse data sets during their research work. In statistics, the statistical range of data is fundamental to establish the difference between the highest and lowest value.
Definition: Statistical range of data
Statistical range of data refers to the variation between the largest value and minimum value within a data set.
One can calculate the statistical range of data by subtracting the minimum value from the maximum value. If the range is large, the values have high variability. If the range is small, the values have minimal variability.
Calculating the statistical range of data
The formula applied in calculating the range is:
represents range
stands for the maximum value in a data set
represents the lowest value in a data set
This formula helps one measure the variability of the values in a data set. For one to determine this variability, they should observe the following steps:
- Arrange all the values from a data set from the lowest to the highest.
- Subtract the minimum value from the maximum value.
These steps apply to all forms of values, including fractions, negative values, positive values, and whole numbers. One has to be cautious when dealing with negative values as a value with a big number does not equate to having a bigger value.
What can the statistical range of data tell you?
A statistical range of data is an essential measure of variability in a data set that does not have extreme values. This range when combined with units of central tendency can help a researcher establish the span of distribution.

The statistical range of data with outliers
While a statistical range of data is a good and effective way to determine the spread of the values within a data set, it can sometimes have outliers. An outlier refers to a data value that is abnormally distant from the other values.
In the case of outliers, the range may not be an accurate indication of values’ spread/ variability. This inaccuracy is because one extreme value alters the range completely.
Using the example above with an outlier in place of one of the values:
[table “3273” not found /]The new data set with an outlier has a significantly higher range, which signifies more variability than exists among these values. This large range is not an accurate representation as most of the values are closer to the middle value.
The statistical range of data only uses two values to determine variability. As such, the variability can be influenced by outliers. One cannot rely on this individual method to determine the values’ frequency of distribution.
- ✓ 3D live preview of your individual configuration
- ✓ Free express delivery for every single purchase
- ✓ Top-notch bindings with customised embossing

FAQs
One finds the statistical range of a data set by subtracting the minimum value of the dataset from its maximum value.
A range refers to the difference in variation between the biggest value and smallest value in a data set. The range is the simplest tool adapted to determine variability.
Yes. The statistical range of data applies to any type of values in a data set, including fractions.
One can easily find outliers by sorting the values from the lowest to the highest values. If there’s an abnormal difference between these values, there is an outlier.
Other methods of finding outliers include interquartile range and other statistical procedures.
