In the realm of statistical research, one primarily encounters four types of data: nominal, ordinal, interval, and ratio. Ratio data, a qualitative form of data, quantifies variables on an unbroken scale. This article will delve further into the concept of ratio data, providing a comprehensive understanding through examples and in-depth analysis, all aimed at enriching your knowledge of statistics.
Definition: Ratio data
Ratio data is a form of qualitative data. Like interval data, variables in ratio data are placed at equal distances. Also, this scale features a true zero (which means that the zero has a meaning). However, unlike in the interval data scale, the zero in ratio scale implies the absence of a variable for measuring.2
Levels of measurement – Ratio data
There are four main levels of measurement in statistics. Ratio data is the highest among the four measurement levels, and it is the most complex measurement level.
Also, ratio data features all the characteristics of the other three levels. The values can be categorized and ordered. In addition, they have equal intervals and the unique characteristic is that the values in the ratio level take on a true zero.
| Level | Characteristics of the values |
| Nominal data | Categories |
| Ordinal data | Categories, rank/order |
| Interval data | Categories, rank/order, equal spacing |
| Ratio data | Categories, rank/order, equal spacing, true zero |
Note: Nominal data and ordinal data scales are categorical variables, while interval data and ratio data variables are quantitative.
The true zero
The true zero is only found in the ratio data scale. It means there is a total absence of the variable of interest or the one you want to measure. For example, the years of work experience a person has been a ratio variable, as a person can have zero years of work experience.
A true zero in a scale means that you can calculate the ratios of the values. So, for instance, you can say that a person with six years of work experience has thrice as many years as one with two years of work experience.
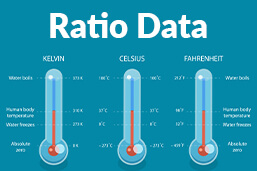
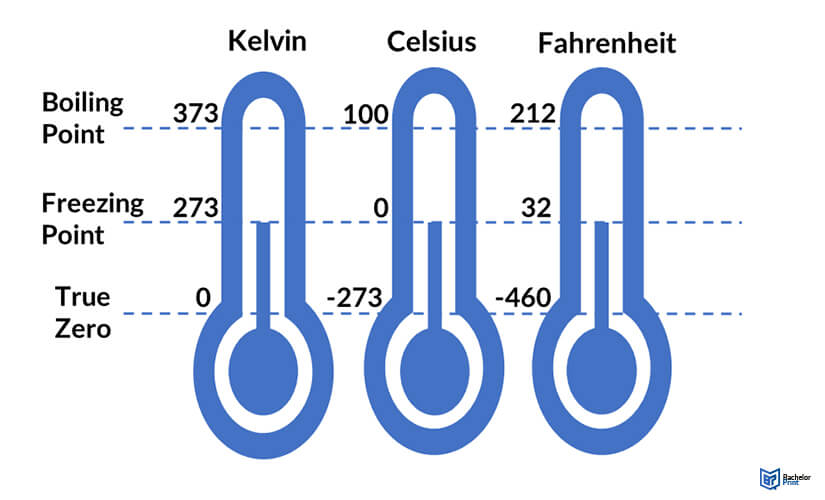
Additionally, variables like temperature can be measured on various scales.
For instance, Celsius and Fahrenheit temperature measurement units are interval scales, while the Kelvin unit is a ratio scale. All three measurement units have equal intervals between adjacent points.

So, for example, zero in the Kelvin scale means nothing can be colder. On the other hand, in the Fahrenheit and Celsius scales, zero is just another temperature value.
Therefore, you can calculate temperature ratios in the Kelvin scale but not in Celsius or Fahrenheit. For example, while 40 degrees Celsius is twice 20 degrees Fahrenheit, it does not mean it is twice as hot. However, 40 Kelvins is twice as hot as 20 Kelvins because the true zero is the starting point.
A true zero means you can multiply, divide, or find square roots of values in a scale. Also, collecting statistical data on a ratio measurement level is highly preferred over other levels because of its accuracy.
Examples of ratio data
The ratio scale is a preferred measurement level in natural and social sciences. Ratio data can be discrete (only expressed in countable figures, like integers) or continuous (can take on infinite values).
Ratio data analysis
The first step is collecting ratio data, then gathering the descriptive and inferential statistics. The best thing about ratio data is that all mathematical operations are applicable. Therefore, almost all statistical assessments can be executed on the ratio scale.
Overview of the frequency – distribution
By constructing a table or graph, you can determine the frequency of the various variables.
Central Tendency
You can determine the central tendency by calculating the data’s mean, median, or mode. However, the mean is the most preferred computation because it uses all the values in your data set.
Mode
This is the most frequently repeating variable in a discrete data set. Continuous variables typically do not have a mode because of infinite value possibilities. In our example, there is no mode because each variable appears once.
Median
This is the value in the middle of your data set. The formula for calculating the median is (
=total number of values). In our example, the median is:
The value in the 26th position is 36.4 minutes
Mean
The formula for calculating the mean is:
In our example, the mean is: 1883.5 divided by 52 = 36.9
Variability
Variability refers to how the data is spread. You can describe the variation in ratio data by finding the range, variance, and standard deviation. The easiest mathematical computation is the range because standard deviation and variance are more complex, yet more informational.
Range
The range is calculated by subtracting the lowest value from the highest in your data set. In our example, the range is minutes.
Standard deviation
This is the average variability in your values. You can calculate standard deviation using specific computer programs. In our example, the standard deviation is 13.4.
Variance
The variance is the square of the standard deviation. It means the difference between a value in your data set and the mean. The variance in our example is .
Coefficient of variation
This standardized measure of dispersion tells you how variable your data is in relation to the mean. It is calculated using the formula:
In our example, the CF is
- ✓ Free express delivery
- ✓ Individual embossing
- ✓ Selection of high-quality bindings
Statistical tests
Finally, you can determine the appropriate statistical inferences with the overview of your data. For instance, parametric tests are ideal for testing hypotheses in normal ratio data distribution.
Parametric tests are powerful inferences because they allow you to draw stronger and more precise conclusions from your data than non-parametric tests. However, the ratio data must meet several requirements before parametric tests apply.
FAQs
The primary difference between interval and ratio data is that in the latter, zero means the total absence of the derivable you are measuring. Interval data does not contain a true zero.
The four measurement levels are:
- Nominal data
- Ordinal data
- Interval data
- Ratio data
Discrete variables represent counts or figures. On the other hand, continuous variables represent measurable amounts.
It is a statistical technique that tells you how precisely variables are recorded.
