In statistics and research, students often find themselves confronted with the objective of conducting a study. While there are many methodologies to do so, one especially promising is the hypothesis testing. There, you can formulate two hypotheses that exclude each other and use your findings of the study to determine which one is correct. The following article will teach you what hypothesis testing is and how you use it in your academic writing.
Definition: Hypothesis testing
Hypothesis testing is a statistical method where an analyst or researcher attempts to study a statement related to a given population parameter. The reason for this analysis and the data currently available determines the research methodology that the analyst will apply. The hypothesis test itself determines whether a hypothesis can be accepted as most plausibly true or not.
Step-by-step guide
Conducting a statistical hypothesis testing may look a lot more complicated than it actually is. The following steps will lead you to a successful result.

Costruct the hypotheses
The first step is to phrase the null hypothesis and alternative hypothesis. The alternative hypothesis (Ha or H1) always states the objective of your research, the assumption you have, while the null hypothesis (H0) covers everything else. Here, you differentiate between a one-tailed test (either left or right), also referred to as a composite hypothesis, and a two-tailed test, also called a simple hypothesis. This can mean that the Ha focuses either on a critical region or on one single result.

Data collection & significance level
The probably most important step is collecting your data. You can do this by using different sampling methods, conducting interviews or questionnaires, or any other methodology that suits your needs. However, you should always check for research biases, as they can highly influence the validity of your study in a negative sense or warp the results of your hypothesis testing.
The level of significance (α) is the probability of rejecting the null hypothesis when it is actually correct. Typically, the level of significance is set to 5%, but depending on your study, previous research or importance of the result, it can also be set to 1%, 10% or anything you deem suitable. Just in case this seems confusing: yes, you just define the level of significance. There is no calculation or procedure to determine it. If you are unsure of what error rate to use, you can ask your professor or look up what similar studies have used.

Selection and conduction of a test
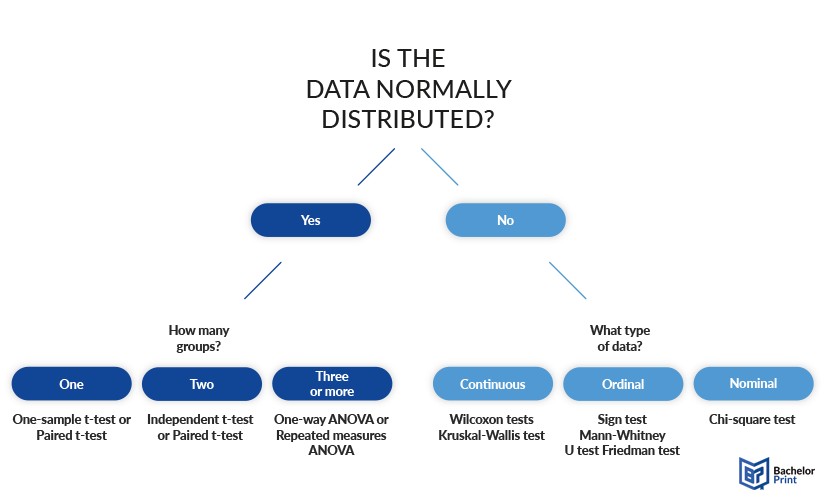
Select the fitting test for your type of data for your hypothesis test. The following chart will show you how to choose the right test. The first question you will have to ask yourself is whether your data is normally distributed or not. A normal distribution is always symmetric around its mean, which is the base for any statistical test.
If your dataset is normally distributed, you use parametric tests according to how many sample groups you used. These can include any type of t-tests and ANOVAs. If your dataset is not normally distributed, your decision depends on the types of variables present in your study, selecting either non-parametric tests or the Chi-square test, which is again parametric.


Decision
After calculating all relevant values, it is time to make a decision on one of the hypotheses. Usually, a researcher looks to reject the null hypothesis, since the alternative hypothesis states his opinion or assumption. In a t-test, for example, there are two ways to determine which hypothesis is less plausible.
- Reject H0 if the test statistic > critical value.
- Reject H0 if the p-value < the significance level (α).
Typically, you decide on one of the two ways, but both of them should give you the same result. If you want to know how to conduct each of the possible tests, take a look at our corresponding articles.

Presentation of the results
In a research paper, your thesis or a dissertation, the results of your hypothesis testing are presented in the results and discussion sections. The results section gives a brief summary of your findings, stating objectively what your research found. In the discussion, on the other hand, you will comment on whether the results supported or rejected your primary assumption and what this tells you about your research topic.
When writing your thesis, keep in mind that hypothesis testing only defines the most plausible hypothesis and never proofs one of them for good. These tests are based on a sample, which always has a possibility of varying from the actual population. Moreover, if you reject the null hypothesis, you will not state that directly but rather emphasize the findings that support your alternative hypothesis. However, if, against your assumptions, you had to reject your Ha, it might be interesting if you discuss this more closely and describe the reasons for the situation.
Hypothesis Testing: Example
Peppermint Essential Oil (t-test)
Chamomile, lavender, and peppermint are some of the most popular essential oils available today. Having heard about their ability to reduce anxiety, you may want to prove whether this essential oil does indeed have some healing powers.
In this case, the hypothesis is likely to go as below:
I. The null hypothesis—As an essential oil, peppermint doesn’t assist in reducing anxiety pangs
The alternative hypothesis—Peppermint is capable of reducing anxiety pangs
II. Level of significance—Place the significance level at 0.25 (this will provide you with a better opportunity to prove the alternative hypothesis).
III. P-value—It’s calculated as 0.05
IV. Conclusion—Once one of the groups is proven using a placebo and the other with peppermint oil, you will need to differentiate the two according to the self-reported anxiety levels. Using your calculations, any difference that exists between the two test groups will be statistically important when it has a 0.05 p-value. This is well-below the pre-defined 0.25 alpha level. The conclusion will, therefore, note that the results of your examination support the alternative hypothesis.
Type I and type II errors
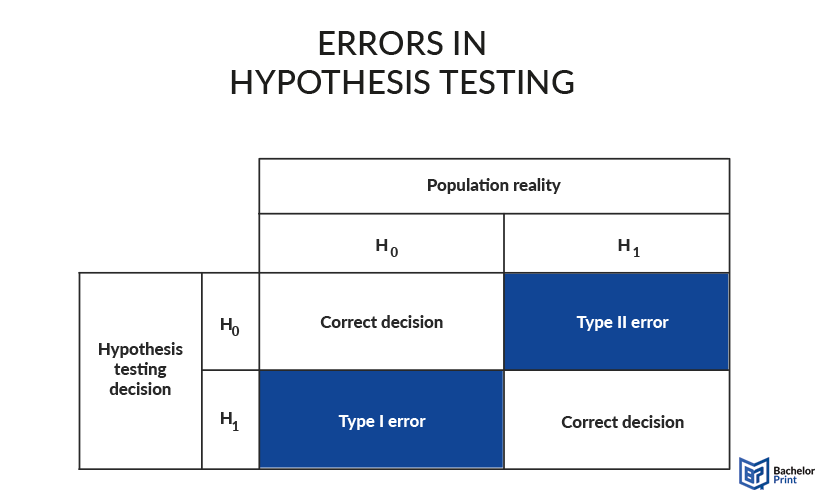
Type I and type II errors are possible mistakes in the decision for one hypothesis. They are also sometimes referred to as α and β mistake. Both of them originate from assuming the wrong hypothesis as right. The first type of error occurs when the null hypothesis is falsely rejected. The second type of error happens when H0 is falsely accepted. Both of them can lead to a wrong conclusion on the population standard.

Applications of hypothesis testing
Hypothesis testing is, of course, used in academic writing and scientific papers. However, there are also many applications outside academic science. Fields like for example economy, healthcare and manufacturing use hypothesis testing to gain valuable insights on their target groups or market development.
Hypothesis Testing – FAQs
Before it comes to printing & binding your dissertation, you need to do your research, which often includes hypothesis tests. There is no variation in the manner in which hypothesis tests are performed or written. In hypothesis testing, the researcher should start by stating the hypothesis that they intend to examine. From here, they will need to formulate a plan on how to conduct the analysis, and then study their sample data. Sample data analysis is then followed by the acceptance or rejection of the null hypothesis established earlier.
An examinable hypothesis is never a simple statement. The researcher has to come up with an intricate statement capable of providing a flawless overview of the scientific experiment at hand. It should also state the intentions of the experiment and the outcomes likely to be achieved. During hypothesis testing, you will need to consider the following:
I. Start by stating the problem you would like to solve.
II. If possible, ensure the hypothesis you craft appears in the form of an if-then statement.
III. Outline all your variables.
Hypothesis testing generally has five steps:
- formulating of the hypotheses
- data collection and determination of the level of significance
- selection of the suitable test plus its conduction
- decision to accept or reject the null hypothesis
- presentation of the results
For hypothesis testing, you usually use one of these statistical methods: a t-test, an ANOVA or a Chi-square test.
