When you hear the word tree diagram, you most likely think about mathematics and probability calculations from school. However, tree diagrams have a great variety of other uses, which are even more common. The field of statistics makes great use of these kinds of diagrams, showing a wide range of applications for these diagrams, which will be explained in the following article.
Definition: Tree diagram
A tree diagram visually represents a cause-consequence chain or a mathematical probability. At the base, also called “trunk” or “root node,” stands the initial situation. From there on, follow two or more branches, which result in different outcomes or “nodes.” Each node then splits into branches again, resulting in further nodes until it ends in final “leaf nodes.”
Contrary to the visual, the root of a problem is set at the very end of a branch, not at the trunk. This can cause a little confusion at first. However, if you remember that the trunk is the starting point and that with each level of branches, you go deeper into detail, it becomes more logical that you are working towards the cause.
In the case of a decision tree, it might be the other way around because you start with your initial situation, where you are faced with a decision you have to make. There the branches split into the potential outcomes.
All in all, the easiest way to put it is that with each layer you add, you work towards the thing you are searching for, which can be a cause or root as well as a consequence.
Printing Your Thesis With BachelorPrint
- High-quality bindings with customizable embossing
- 3D live preview to check your work before ordering
- Free express delivery
Configure your binding now!
Types and examples
There are many different types of diagrams, finding application in science, economy, and daily life.
The most common usage might be the probability tree from the field of mathematics. There, the tree diagram is used to describe probabilities in a chain of either independent or dependent events.
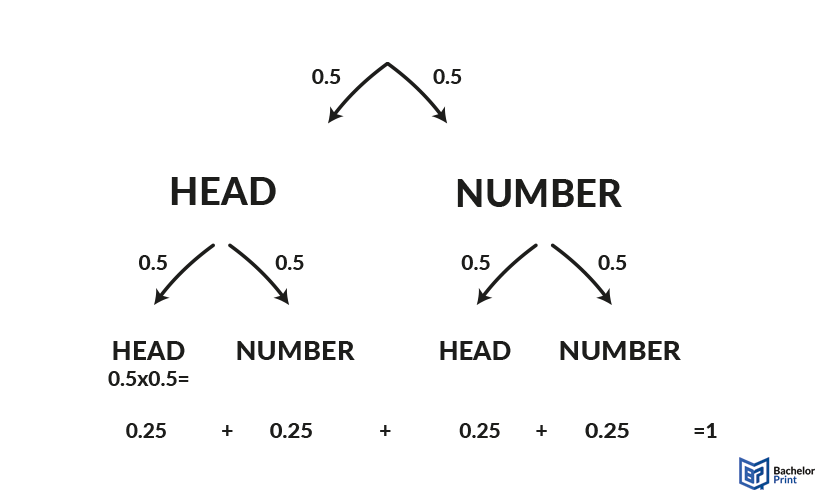
At an independent event, the probability of the second level does not depend on the first layer. This is the case of example a coin toss. Each toss is independent, and the outcome of the first toss does not say anything about the outcome of the second.
At dependent events, the previous results do affect the next. An example of this would be drawing lots without replacement. If one lot is taken, the probability for the other ones changes.
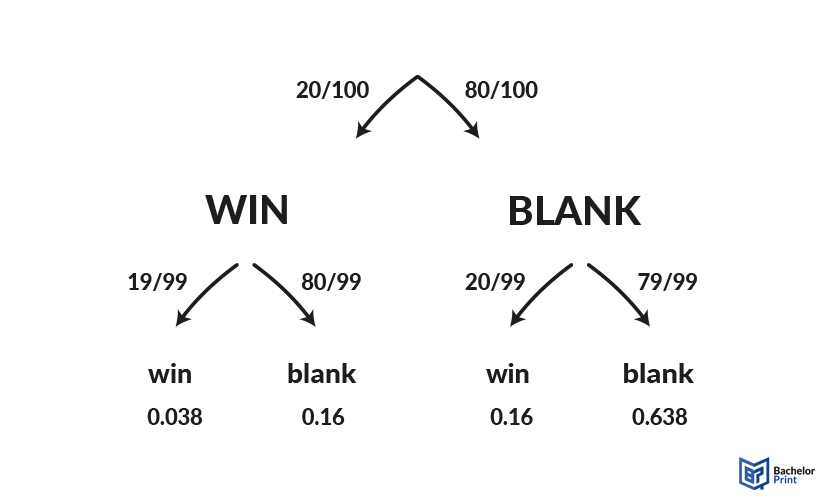
Here, the probability is written on the branch, while the node names the outcome. To calculate the likelihood of the result at the very end of a branch, you need to multiply the probabilities, starting from the trunk and working your way down to the outcome.
Probabilities on the same level, meaning nodes coming from the same point of origin, can be added together. All probabilities on the same level have to amount to 1 in the end.
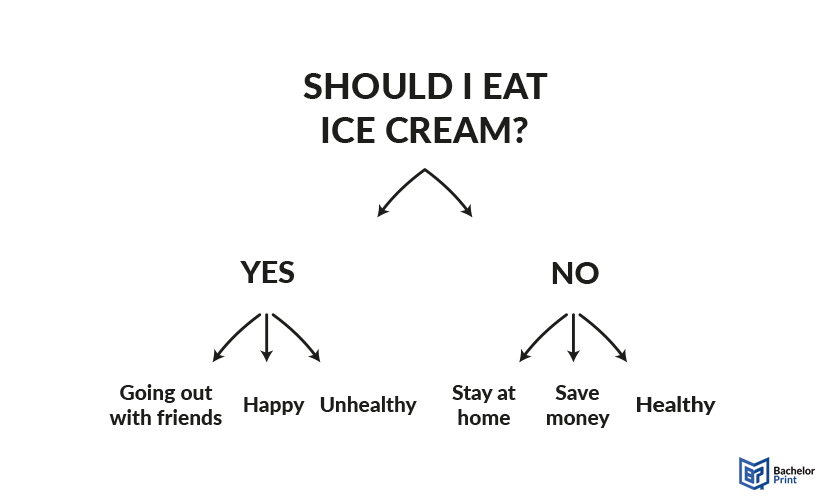
Another way of using tree diagrams is for making decisions and brainstorming scenarios. When making decisions, we often have to think about the possible results and outcomes of our actions. By using a tree diagram, we are forced to not only focus on the big picture but also get into the tiniest details. Depending on these outcomes, we can then make our decision. The respective answer nodes can either contain a simple “yes” or “no,” or fully detailed explanations.
Similar to the previously described type, a tree diagram can be used for solving problems or identifying issues in a chain of events. In this case, you are searching for the root of something, starting from the current situation.
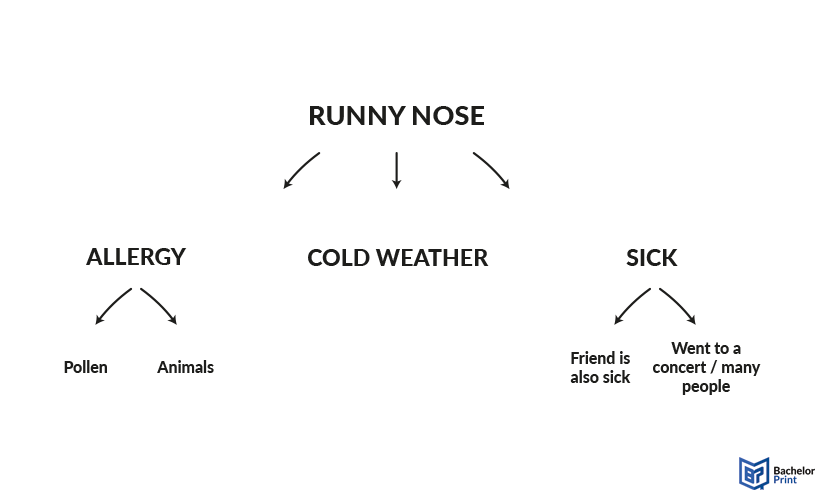
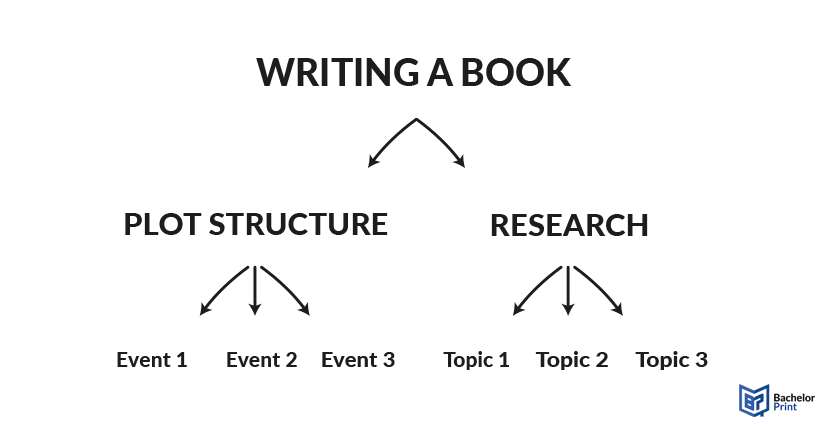
Especially for effective schedules, a tree diagram can be used to define a task hierarchy. There you start from your goal at the trunk and split the tasks further and further into little pieces. On the other hand, you can also build your diagram by deciding what needs to be done before another task, sorting them by level of urgency.
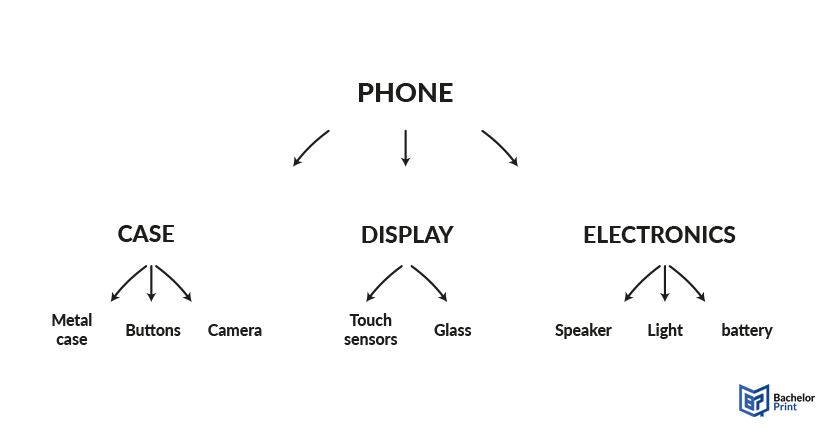
In the production industry, you may find a special tree diagram called “Gozinto.” The name originates from “goes into” because this diagram describes the resources and components of a product. There you start with the finished product and divide it into its parts, level by level.
Making a tree diagram
Building or drawing a tree diagram is not all that difficult. The following five steps will help you make and complete the diagram.
- Identify the main point, the trunk. This can be your initial situation, the problem, or a blank node you split your probabilities off from, in the case of the mathematical tree diagram.
- Secondly, you add the immediate consequences, closely related points, or the mathematical outcomes of your experiment.
- Then you continue to add additional nodes level by level until you find your ending point. There is no rule about how many nodes you can add, but do not add too many nodes, or it becomes confusing.
- After you finish the tree diagram, read it through from the top to the bottom. Sometimes things make sense while you write them, but after looking at the whole picture, you may find logical mistakes.
- Lastly, adjust the diagram if the situation changes. Tree diagrams are designed to follow a chain of events. This means that if something changes, the entire diagram may have to be corrected accordingly.
FAQs
Tree diagrams can be used in various ways, including mathematical probability events, decision-making, problem-solving, or organization. Depending on the usage of the diagram, the structure, and making can vary.
To make a tree diagram, you need to identify your starting point. From there, you add closely related events, step by step, building each layer as you go into the details until you reach the end of the chain. In mathematical probability diagrams, you start with the outcomes of your first experiment or condition, before adding the second experiment or its consequences on the next level of nodes.
Apart from the obvious visual difference, a tree diagram shows a chain of events, dependent or independent, and their whole probability. A fourfold table, on the other hand, links two events and shows the probability of that link.