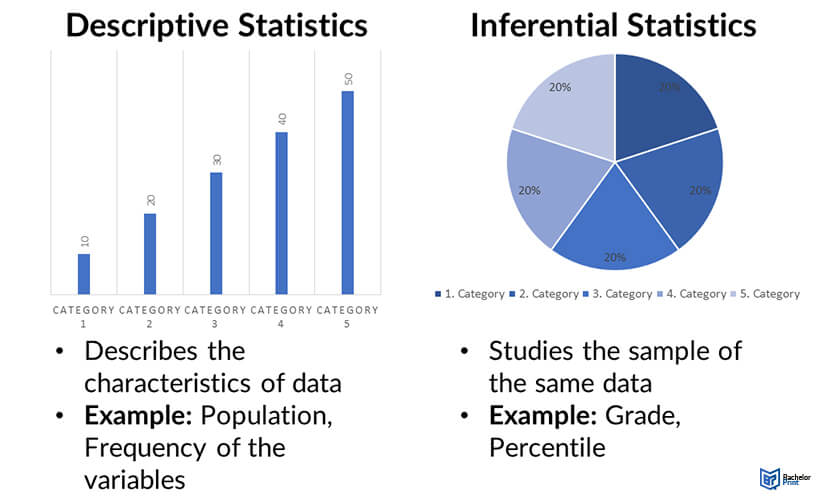
Inferential statistics is a branch of statistics that uses sampled data to make predictions or draw conclusions about a larger population or dataset. Using inferential statistics, you attempt to draw conclusions beyond the immediate facts. For instance, we use inferential statistics to infer what the population may believe from sample data. Alternatively, we utilize inferential statistics to determine whether a difference between groups seen in this study is either reliable or the result of random chance.
Definition: Inferential statistics
Inferential statistics is a discipline that collects and analyzes data based on a probabilistic approach. It helps us make conclusions and references about a population from a sample and their application to a larger population.
There are many types of inferential statistics, and each is appropriate for a research design and sample characteristics. It is used to compare two models to find which one is more statistically significant compared to the other.
Descriptive statistics vs. inferential statistics
Descriptive statistics organize, summarize, and display the characteristics of a data set using bar graphs, histograms, or pie charts. They involve the measures of central tendency: Mean, Median, and Mode, measures of dispersion as the tools, and measures of variability: Range, variance, and standard deviation.
Inferential statistics allow us to test a hypothesis and assess whether the data is generalizable to the broader population. Sample data is also used to make inferences and draw conclusions about the people, and the results are in the form of probability.

Inferential statistics: Hypothesis testing
Hypothesis testing is a tool for making statistical analyses using inferential statistics. The aim is to compare populations between variables using samples.
It involves the following steps:
1. Determine the null and alternative Hypotheses
The null hypothesis (Ho) states the value of the population is assumed to be true. The alternative hypothesis (H1) contradicts the null hypothesis. It’s the informed guess of all contingencies not covered by the null hypothesis.
2. Selecting significance level
The criterion upon which we decide whether the claim is being tested is true or is determined.
3. Determine the rejection region
These consists of the values of the test statistic for which the null hypothesis is rejected.
Comparison of the samples and making two decisions based on the significance level. These include:
- Rejecting the null hypothesis: The sample average is associated with a low probability of occurrence when the null hypothesis is true, if the probability of obtaining a sample is less than 5%.
- Failing to reject the null hypothesis: The sample average is associated with a high probability of occurrence when the null hypothesis is true if the probability of obtaining a sample mean is greater than 5%.
Hypotheses are tested using inferential statistical tests that can be parametric (ANOVA, T-test), which is based on assumptions about the population distribution from which the sample is taken, or non-parametric (spearman’s correlation) not based on an assumption.
4. Comparison test
This inferential statistics test assesses whether there are differences in means, medians, or rankings of scores of two or more groups.
| Comparison test | Parametric | What’s being compared? | Samples |
| t-test | ✔ | Means | 2 samples |
| ANOVA | ✔ | Means | 3+ samples |
| Mood’s median | ✘ | Medians | 2+ samples |
| Wilcoxon signed-rank | ✘ | Distributions | 2 samples |
| Wilcoxon rank-sum (Mann-Whitney U) | ✘ | Sums of rankings | 2 samples |
| Kruskal-Wallis H | ✘ | Mean rankings | 3+ samples |
5. Correlation test
These inferential statistics tests determine the extent to which two variables are associated.
| Correlation test | Parametric? | Variables |
| Pearson’s r | ✔ | Interval/ratio variables |
| Spearman’s r | ✘ | Ordinal/interval/ratio variables |
| Chi square test of independence | ✘ | Nominal/ordinal variables |
6. Regression test
These inferential statistics tests demonstrate whether changes in predictor variables cause changes in an outcome variable.
| Regression test | Predictor | Outcome |
| Simple linear regression | 1 interval/ratio variable | 1 interval/ratio variable |
| Multiple linear regression | 2+ interval/ratio variable(s) | 1 interval/ratio variable |
| Logistic regression | 1+ any variable(s) | 1 binary variable |
| Nominal regression | 1+ any variable(s) | 1 nominal variable |
| Ordinal regression | 1+ any variable(s) | 1 ordinal variable |
Inferential statistics example
The t-test value can be calculated with the following formula:
FAQs
It’s the difference between a population parameter and a sample statistic.
Sample statistics involve change, as it depends upon sample values chosen randomly, hence becoming constant, while the population parameter is a descriptive measure for an entire population.
Random sampling, stratified sampling, cluster sampling, and systemic sampling are the most efficient methods used in inferential statistics.
One limitation is that data provided is not fully measured. Therefore, you cannot be sure that the values or statistics you calculate are correct.
Printing Your Thesis With BachelorPrint
- High-quality bindings with customizable embossing
- 3D live preview to check your work before ordering
- Free express delivery
Configure your binding now!
