In the field of statistics, the mode is a key measure of central tendency, along with the mean and median. These measurements give you an overview about how your dataset is structured and where the focus lies. Central tendencies are often very simple to calculate, especially the mode. Still, it is necessary to know the basics of it to include it correctly into your academic research.
Definition: Mode
The mode represents the most frequently occurring value or values in a data set, also called modal value. It can be applied to qualitative data, as well as discrete quantitative data, as the possible outcomes there are limited. It is furthermore possible to have more than one mode in a dataset or even none at all, although the latter case is very rare.
Multiple modes
Depending on how many modes a dataset includes, they are named as the following paragraphs show.
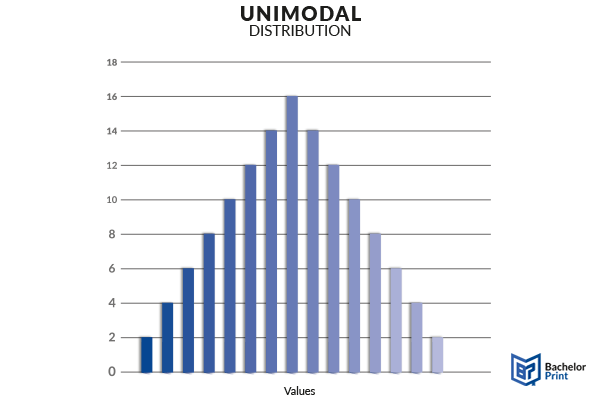
Unimodal
These are datasets that have one value that appears most frequently. If the data is presented in a histogram, there will only be one peak. In a typical normal distribution, the mode lies in the center of the dataset. However, depending on your experiment, any type of probability distribution can appear, and the mode does not necessarily be in the center.
Bimodal
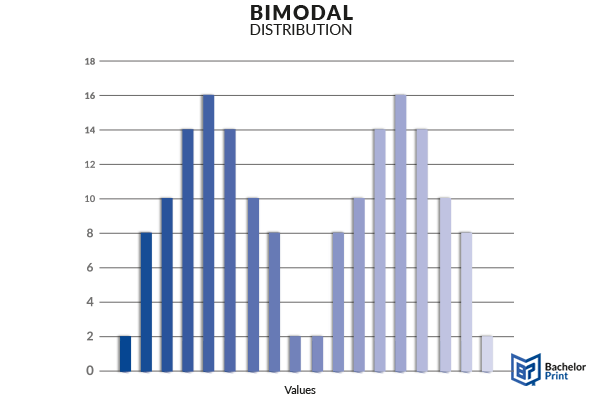
Statistical distributions can have two modes, and these are referred to as bimodal datasets. This can happen, when two values appear with the same frequency. Just as with the unimodal one, a bimodal distribution does also not need to be symmetrical.
Trimodal
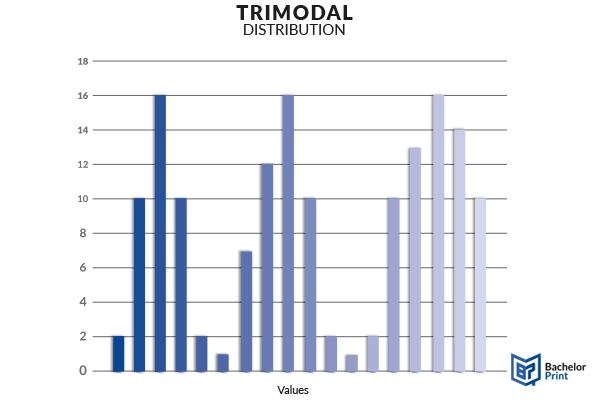
Trimodal datasets have three modes, meaning there are three figures that will appear most frequently in the distribution. The more modes are included in a set, the less likely it is for them to be symmetrical as the variation in the dataset increases.
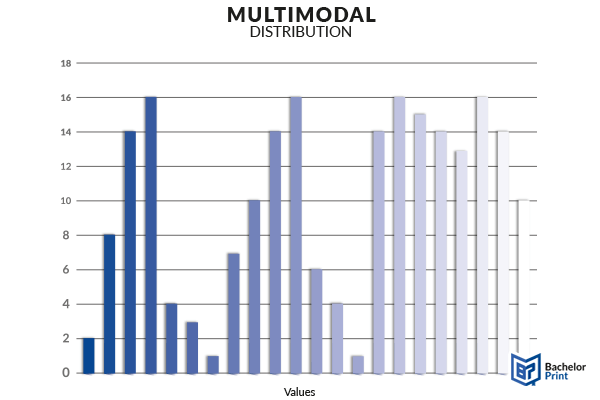
Multimodal
Multimodal datasets have more than three modes. If the dataset is presented in a histogram, there will be more than three peaks. The less values you have, the more likely it is that you have more than one mode, especially with ordinal and nominal data, since the options participants can choose are limited. On the other hand, if you have a huge number of values, even a frequency of 3 or 4 can be a mode, leading to a multimodal dataset as well.
Finding the mode
Finding this value is quite simple. You should follow these steps:
- Start by arranging the numbers in order.
- Then you can count how many times each number appears.
- You should then note the number which appears most frequently.
Categorical data
A categorical dataset includes either nominal or ordinal data. This means that their values are not quantitative but qualitative and either ranked or not.
Numerical data
Numerical data, also called quantitative data, consists of discrete and continuous variables. The mode of a set of discrete variables can be determined in the form of a class interval or a specific value.
- Modal class: With this option, the mode is given as a category.
- Modal value: The mode here will be given as a specific value instead of a class.
The modal class here is 30 to 40. This is because the highest number of figures occur in this category. The modal value is 30 as it appears twice in the dataset.
Continuous variables do not consist of a set of values, but instead of an infinite number of values in one line, such as length or time. Continuous data is often analyzed in the form of class intervals. The concept of mode can then only be a class interval.
The modal class here is 170-180 cm. This is because the highest number of figures occur in this category.
Printing Your Thesis With BachelorPrint
- High-quality bindings with customizable embossing
- 3D live preview to check your work before ordering
- Free express delivery
Configure your binding now!
No mode
In very rare cases, a dataset appears where every value appears in an equal number of times. With such datasets, this method can’t be used to locate the center of the distribution, as there is no mode present.
Measures of central tendency
Not each measure of central tendency can be used with every type of variable, and some might be unnecessary to use in specific cases.
Variables are, first of all, divided into qualitative variables (which do not hold numerical value) and quantitative variables (which have numerical value). Qualitative variables are furthermore split into nominal variables, which include options that cannot be sorted hierarchical, while ordinal variables, can be ranked. Quantitative variables split into discrete variables, where you can count the individual values, and continuous variables, where you usually measure the values.
The following table will summarize when you can use which measure of central tendency. Below I will explain only the column of the mode. For information on the other three, please see the corresponding articles.
Mode
Median
Arithmetic mean
Geometric mean
Nominal v.
x
Ordinal v.
x
Only odd numbered
Only if numbered
Discrete v.
x
x
x
x
Continuous v.
Only in intervals
x
x
x
The mode can be used with nominal data because even if you only have a binary variable, there will most likely be one value chosen more often than the other. When there are multiple options to choose from, the outcome will most likely be multimodal, but this depends on the individual topic.
Respectively it works for ordinal data. When the data is ranked, there will still be one option named the most. However, the derivation in ordinal data is more likely to be unimodal, since a population usually follows a normal distribution when the options are ranked.
Discrete data holds real numerical value but is still countable. Thus, the mode should be visible. If, however, there are too many values in the dataset, the mode is not as expressive.
Continuous variables are generally not suited for defining a mode due to the fact that they are measured instead of counted. Thus, it is almost impossible to gain the exact same value twice. Finding a mode is only possible, when you sort the values into intervals and then count which interval holds the most outcomes.
It is also worth noting the cases where you should never use this method.
- You shouldn’t use this measure if all values appear the same number of times.
- Also, it shouldn’t be used if there is a very small number of values.
FAQs
It is used to locate the most common value in a dataset. It helps researchers draw conclusions about different studies.
The different types are:
- Unimodal (one mode)
- Bimodal (two modes)
- Trimodal (three modes)
- Multimodal (more than three modes)
You can also use the median, which is the central value you get after aligning all values in a row, and mean, which is the average value, as measures of central tendency.
Yes, it will be missing in a dataset where all values appear the same number of times.