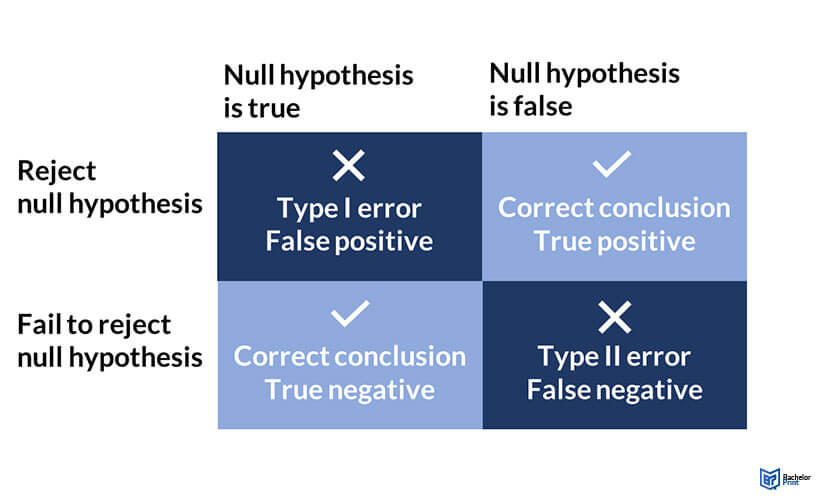
Type I and Type II errors represent potential rejections in hypothesis testing within statistics. A Type I error, also a false positive, occurs when a true null hypothesis is rejected – i.e., when we wrongly conclude that there is an effect or relationship. A Type II error, or false negative, occurs when a false null hypothesis is accepted – i.e., we fail to identify an actual effect or relationship. Understanding these errors is crucial in the interpretation of statistical results and the research design.
Definition: Type I and type II errors
In statistics, researchers can either accept or reject a null hypothesis:
- A type I error in statistics is also known as a false positive and occurs when a null hypothesis is rejected even when it is true.
- A type II error happens when a researcher accepts the null hypothesis even when it is not true, which is known as a false negative.
Hypothesis testing is carried out to test a given assumption in the context of a population. It begins with a null hypothesis which states that there is no statistical difference between two groups. The null hypothesis is used alongside the alternative hypothesis, which defines a statement or proposal under study. Simply put, it is an alternative to the null hypothesis.
You may accept or reject the null hypothesis based on available data and statistical test findings. This probabilistic approach makes it susceptible to type I and type II errors.
Type I and type II errors typically arise from the null hypothesis proposed and the alternative hypothesis created to oppose the null hypothesis.
Type I and type II errors explained
Understanding the relationship between variables in a test scenario helps to identify the likelihood of type I and type II errors. Statistical methods use estimates in making assumptions which may result in type I and type II errors from a flaw in data collection and formulation of assumptions as follows:
Type I errors – False positives
A type I error refers to the situation where a researcher implies that the test results are caused by a true effect when they are caused by chance. The significance level is the likelihood of making a type I error. The significance level is often capped at 5% or 0.05. This means that if the null hypothesis proposed is true, then the test results have a 5% likelihood of happening or less. The initial p-value determines the statistical chances of arriving at your results.
Type II Errors – False negatives
A type II error occurs when the null hypothesis is false, yet it is not rejected. Hypothesis testing only dictates if you should reject the null hypothesis, and therefore not rejecting it does not necessarily mean accepting it. Often, a test may fail to detect a small effect because of low statistical power. The statistical power and a type II error risk have an inverse relationship. High statistical power of 80% and above minimizes the type II error risk.
Error rate type I
The null hypothesis is represented in a distribution curve. Alpha is represented at the tail end of the curve. The null hypothesis is rejected if the test results fall in the alpha region, and the test can be termed as statistically significant. The null hypothesis is accurate in this case, as we have a false positive.
Error rate type II
The error rate for type II, also called he beta error (β) is shown by the shaded region on the left side of the distribution curve. The statistical power is calculated as 1-β (the type II error rate), the remainder of the area outside the beta region. Consequently, if the power of a test is high, the Type II error rate is low.

Consequences of type I and type II errors
Type I and type II errors have different consequences in research studies. However, type I errors are considered worse, even though both type I and type II errors can have adverse effects.
The consequences of type I and type II errors include:
- Wastage of valuable resources.
- Creation of policies that fail to address root causes.
- In medical research, leads to misdiagnosis and mistreatment of a condition.
- Fail to consider other alternatives that may produce a better overall result.
Printing Your Thesis With BachelorPrint
- High-quality bindings with customizable embossing
- 3D live preview to check your work before ordering
- Free express delivery
Configure your binding now!
FAQs
Type I and type II errors are the main errors caused by the treatment of the null hypothesis. A type I error occurs when a researcher rejects a null hypothesis even if it’s true, while a type II error happens when the null hypothesis is false but is not rejected.
Type I and type II errors happen when the null hypothesis is not treated per the test provisions. If a null hypothesis is rejected or not rejected accordingly, it leads to type I and type II errors in a study.
Statistical power implies the probability that a statistical test rejects the null hypothesis correctly. A low statistical power of below 80% increases the likelihood of a type II error.
To minimize the chance of making a type II error, aim for high statistical power of 80% and above. Use a low significance level to minimize the chance of a type I error.
