In the sphere of statistics, understanding the distinction between a parameter vs. statistic is an imperative factor. A parameter is a numerical value that depicts a particular group of a whole population. In contrast, a statistic is drawn from a sample derived from that entire population. Inferences about a whole population are often made based on samples, which is why it is important to be able to distinguish parameters from statistics in order to ensure accurate representations and results.
Definition: Parameter vs. Statistic
When differentiating a parameter vs. statistic, use the size of the groups. If you randomly survey a group of people that use a specific brand, the value you get is a statistic, since you only asked a small percentage of the entire population. In research, the terms parameter and samples are used to denote the extent of the research. In quantitative research, the researcher wants to understand the characteristics of a population by determining the parameters. Since it is unfeasible to collect data from an entire population, data is gathered from samples. In inferential statistics, the conclusions from sample statistics are used to infer and hypothesize about the population parameters.
- ✓ 3D live preview of your individual configuration
- ✓ Free express delivery for every single purchase
- ✓ Top-notch bindings with customised embossing

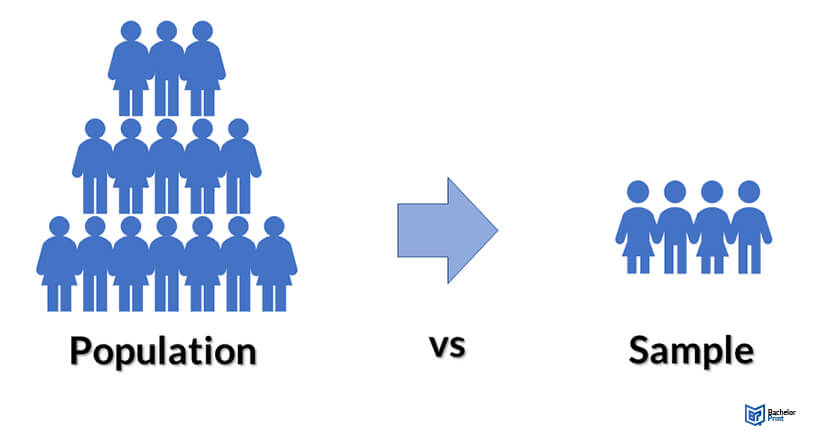
Parameter vs. Statistic: Population vs. Sample
Estimating parameter vs. statistic relies on the population and samples collected for the research. A population represents the entire group you are surveying. You can research a group of people, organisms, countries, organizations, and objects based on your research. A sample is a small group that represents a percentage of a larger population. You will collect data from the samples to make educated guesses about the entire population.

Parameter vs. Statistic: Number types
When defining parameter vs. statistic, you summarize any measurable features of the population or sample.

In research, you get sample statistics when you use the sample collected to calculate the mean and standard deviation. The most common types of numbers in parameter vs. statistic include:
- Categorical variables: The parameter or statistic used is a proportion.
- Numerical variables: The parameter vs. statistic numerical variables are reported using mean, median and standard deviation.
Statistical notation
Diverse symbols are used for parameter vs. statistic to indicate whether you are referring to a population or a sample. Latin and lowercase letters denote samples in most cases, while Greek and capital letters show populations. Some of the statistical notations of parameter vs. statistic include:
| Sample Statistic | Population Parameter | |
| Mean | ||
| Standard Deviation | ||
| Proportion | ||
| Size |
Distinguish a parameter from a statistic
In research reports and news, it can be challenging to determine whether a number is a parameter or a statistic. When differentiating parameter vs. statistic, use the following questions as a guide:
- Does the value represent the entire population, where every member participated in data collection?
- Can you collect data on a particular characteristic from every member in a reasonable time frame?
When you are distinguishing parameter vs. statistic, the size of the population or sample makes a difference. If the answer to the questions above is yes, the number is a parameter. If the answer is no, then the value represents a statistic.
Parameter vs. Statistic: How to estimate
In parameter vs statistic estimations, researchers use a sample to collect data from a large population and generalize the statistic to a broader population. Inferential statistics allow you to estimate population parameters from sample statistics. The two types of estimates about a population include:
- Point estimate: It provides a single numerical value of the population parameter based on the sample statistic. For example, a sample mean can be a point estimate of the population mean.
- Interval estimate: It provides a range of values where the parameter lies. A common interval estimate is the confidence interval.
FAQs
A parameter represents an entire population, while a statistic represents a sample. When differentiating parameter vs. statistics, the size of the population used in research matters.
If the number describes an entire population and you can collect data from every member, the value represents the parameter. When you are only sampling a section of the entire population, it is a statistic.
If you are studying a large population, you can study random samples and make inferences about the population. The population or sample used for data collection differentiates parameter vs. statistics.
