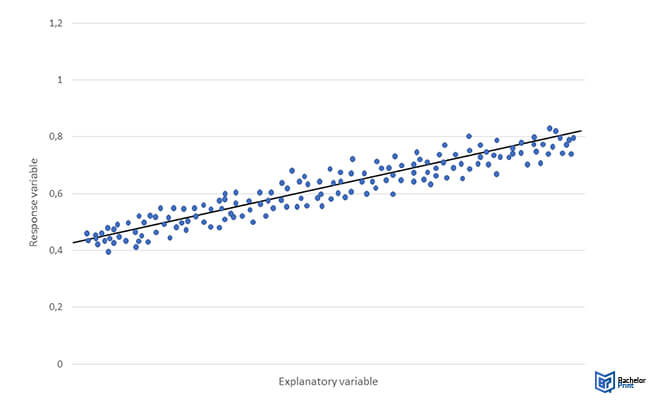
In statistical modelling, understanding the difference between explanatory vs. response variables is vital. The explanatory variable defines the independent variable or predictor variable and entails the input you control or manipulate in a study. The response variable, often called the dependent or outcome variable, is what you measure or observe. Understanding the roles of these two types of variables is fundamental to designing experiments and interpreting the results effectively.
Definition: Explanatory vs. Response variables
Explanatory and response variables are assigned in the methodology. The best way to describe explanatory vs. response variables is by defining them separately.
An explanatory variable is the one you manipulate or analyse changes in.
On the other hand, response variables are those that change as a result of the manipulation of explanatory variables.
Explanatory vs. response variables
The difference between explanatory vs. response variables is:
- Explanatory variables are those you can alter and manipulate in experimental research. In contrast, response variables are those that change as a result of the manipulation of explanatory variables.
- Repsonse variables represent the expected cause and explain the outcome of the research. In contrast, response variables represent the expected effect and response to the manipulated explanatory variables.
So, in research, you expect changes in the response variables to occur only after an alteration in the explanatory variable.
Besides this, there is a causal correlation between explanatory vs. response variables. The causal relationship may be direct or indirect. For instance, an explanatory variable acts on the response variable via a mediator in an indirect correlation.
However, research focusing purely on correlational relationships has no explanatory or response variables. So, even if the changes in one variable impact the other, both changes may result from a confounding variable.
Explanatory vs. response variables – Examples
In simple research, you may only have one explanatory variable and one response variable. However, in complicated ones, you may need several explanatory variables in a model to predict one or more response variables.
The table below illustrates examples of the differences between explanatory vs. response variables:
Independent variables
Explanatory variables are sometimes referred to as independent variables because they are incredibly similar. However, few key elements set them apart. These differentiating elements are:
- Independent variables are not affected by the dependent variables or any other variables in the research. Instead, they are altered or manipulated only by the researcher.
- Explanatory variables can be independent or not. For instance, in real-world contexts, where you cannot alter the variables, they are called explanatory instead of independent variables.
The terms explanatory vs. response variables are usually used in regression analyses. Regression analyses focus on accounting for or foreseeing changes in response variables due to explanatory variables.
Illustrating explanatory vs. response variables
A graph is the best method for illustrating the correlation of explanatory vs. response variables. A graph will clearly visualize what happens to the response variable when the explanatory variable changes.
A typical graph features an x-axis and a y-axis. So when illustrating the correlation of explanatory vs.response variables, the former should be placed on the x-axis, while the latter should be on the y-axis . (x-axis- explanatory variable, y-axis- response variable.)

Other things you should consider are:
- If your research features quantitative variables, a scatterplot or line graph is relevant.
- If your research features categorical response variables, a scatterplot or line graph is relevant.
- If your research features a categorical explanatory variable, a pub graph is relevant.
- If you have only one response variable and one explanatory variable, collecting paired data is relevant.
FAQs
The difference between explanatory vs. response variables is that the former explains the results/is the expected cause, while the latter responds to the explanatory variables.
Explanatory variables are sometimes called independent or predictor variables. In contrast, response variables are sometimes called dependent or outcome variables.
The role of explanatory variables is manipulation and alteration in experimental research. On the other hand, response variables help researchers understand the outcome of an experiment.
The best method for visualizing explanatory and response variables is using a graph, where the x-axis represents the explanatory variable and the y-axis illustrates the response variable.
