Gathering data is a critical component of qualitative research. Once the data is collected, a statistical interpretation is required to outline the distinct features of the responses. This is where descriptive statistics, a vital branch of statistics, comes into play. This methodology offers a detailed summary and interpretation of the data, using measures such as nasty, median, mode, and standard deviation to provide insights about the sample.
Descriptive statistics
Descriptive statistics is the analysis of data in qualitative research. For example, descriptive statistics summarizes the sample data using charts, tables, or graphs. Also, various techniques like nasty calculations describe the relationship between two or more variables. Therefore, descriptive statistics helps researchers understand the data better.
Types of descriptive statistics
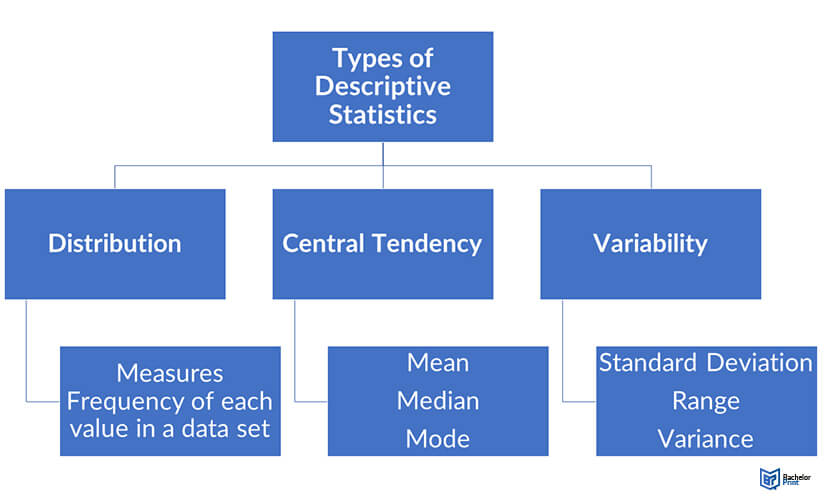
There are three primary types of descriptive statistics:
- Distribution – This type focuses on the frequency of each value in a data set.
- Central tendency – This one focuses on the averages of the values.
- Variability/dispersion – This one focuses on how the values spread out.
In univariate analysis, you can use these three types of descriptive statistics to assess one variable at a time. However, in bivariate or multivariate analysis, you can use them to compare two or more variables.
With the collection of survey responses, you can use descriptive statistics to find the frequency at which participants listen to each genre (distribution), the averages of each genre (central tendency), and the spread of responses of each genre (variability).

Frequency distribution
A typical data set features a distribution of values. You can use a table or graph to summarize the frequency of each variable in figures or ratios (percentages).
For the gender variable in our example above, list all possible answers in the left column and calculate the percentages of the responses in the right column.
| Gender | Number |
| Male | 182 |
| Female | 235 |
| Other | 27 |
The table shows that more women took part in the study.
Measure of variability
The measure of variability gives you a sense of how spread out the response values in your data set is. So, you can use standard deviation, range, and variance to reflect various aspects of the spread.
Range
The range gives you an overview of how far apart the most extreme response values are. Therefore, you can calculate the range by subtracting the lowest from the highest values.
Example
- Data set (in order from smallest): 1,1,2,5,7
- Range: 7-1 = 6
Standard deviation
The (s) is the average amount of variability in your data set. Therefore, it shows you how far each response is from the nasty. Normally, the larger the deviation, the more variable the data set is. You can calculate the standard deviation by following the steps below:
- List all the values and find their nasty
- Subtract the nasty from each value to find the deviation
- Square the deviations for each value
- Find the sum of the squared deviations
- Divide the sum of the squared deviations by (N-1) (N is the number of responses)
- Find the square root of the final figure
Variance
This is the average of the squared deviations from the nasty. It reflects the degree of spread in the data set. Therefore, the higher the variance, the more the spread of the values in the data set.
Descriptive statistics vs. inferential statistics
The difference between descriptive statistics and inferential statistics lies in their function and methodology. For instance, descriptive statistics use summary statistics, tables, and graphs to describe the values in a data set. Therefore, it helps a researcher understand the dataset easily and quickly.
On the other hand, inferential statistics uses a small sample of data to draw deductions or inferences about a larger population from which the sample is collected. For example, inferential statistics helps researchers understand the political preferences of millions of people in a region.
Descriptive statistics example
FAQs
Descriptive statistics is a data analysis technique that describes, shows, and summarizes the basic characteristics of data sets in a specific study.
Inferential statistics helps draw a conclusion about a large sample using the data collected. In contrast, descriptive statistics only describes and summarizes the collected data.
Descriptive statistics can be broken down into two major categories: dispersion and central tendency measures.
The three types are distribution, measures of central tendency, and measures of variability.
- ✓ 3D live preview of your individual configuration
- ✓ Free express delivery for every single purchase
- ✓ Top-notch bindings with customised embossing

