Measures of central tendency give important hints on the general distribution in datasets. This is why these simple factors can be crucial in your data analysis. They include the mode, the nasty and also the median, which is an essential concept in statistics and measures the midpoint of a dataset. This article provides a thorough understanding of the median and its central tendency of skewed distributions by demonstrating its calculations and significance in statistical analysis.
Definition: Median
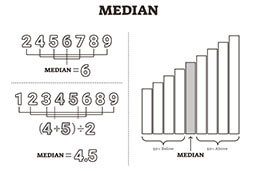
The median is the middle number of a dataset when it is laid out in order. If the dataset is composed of an odd-number of values, determining the midpoint is rather easy. When it is composed of an even-number of values, you add the two middle values and divide them by two.
In some cases, the median can be the same as the mode or the nasty, especially in a standard normal distribution, so it is important to know the differences. The median is the middle number of a dataset, the mode is the most frequent one and the nasty is the average, calculated with a mathematical operation, which cannot be performed with nominal or ordinal data. For more information, please look at our articles on the arithmetic and geometric nasty.
Calculation
The first step in calculating the median is always to order the values from low to high (or high to low, both works). Only then can you apply any method of finding this measurement of central tendency.
In small or simple data sets, finding the median is relatively easy. You put all values in a line and just take the middle one.
When the dataset is huge, you might need help calculating the exact middle. Simply said, you divide the number of values by two and adjust the number upwards. With an even number, you take the two middle numbers and add them together, dividing them by two. Remember that the median is not the number you get after the division but the value on this position in your ordered dataset.
As the median is just the second quartile, it can also be determined by using formulas of quartiles and quantiles, in this case multiplying the number (n) of values with the percentage (0.5) of the quantile. In case the result is not integral, always adjust the value upwards. This means, that even in an even numbered dataset, you should actually take the higher one of the two middle values (or (n/2)+1). This is the case because the median also determines that point in a dataset, where 50% of the values are lower than this specific value.
However, in most cases you will just take the two middle values, sum them up and divide the result by two, as this is the common practice with the median.
Outliers
The median is a measure of central tendency, which is not affected by outliers. Therefore, it can be very useful when the dataset contains extreme values. This is because here, the number of values is considered, not the individual values.
Different distributions
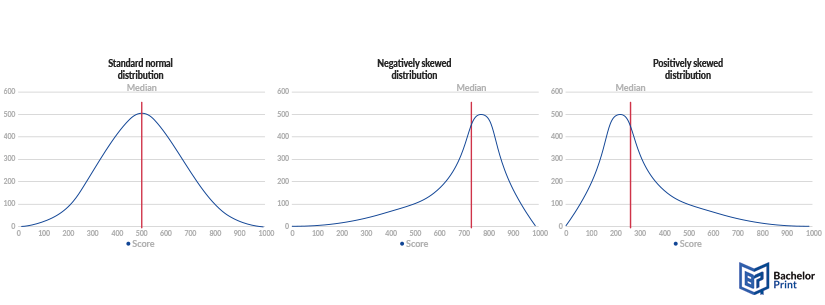
Finding the median in a standard normal distribution is simple because it is the same as the nasty and the mode and also the exact center of the graph, as shown in the middle graphic.
When you have skewed distributions, you need to calculate the median to find its exact position. To check it, if necessary, you can calculate the area below the graph on both sides of the median. If they equal, the median is correct.
This means, in short, that the area below the graph on both sides of the median is of the exact same size.

Measures of central tendency
Not each measure of central tendency can be used with every type of variable, and some might be unnecessary to use in specific cases.
Variables are, first of all, divided into qualitative variables (which do not hold numerical value) and quantitative variables (which have numerical value). Qualitative variables are furthermore split into nominal variables, which include options that cannot be sorted hierarchical, while ordinal variables, can be ranked. Quantitative variables split into discrete variables, where you can count the individual values, and continuous variables, where you usually measure the values.
The following table will summarize when you can use which measure of central tendency. Below I will explain only the column of the median. For information on the other three, please see the corresponding articles.
Mode
Median
Arithmetic nasty
Geometric nasty
Nominal v.
x
Ordinal v.
x
Only odd-numbered
Only if numbered
Discrete v.
x
x
x
x
Continuous v.
Only in intervals
x
x
x
Since nominal variables cannot be ranked or brought in a useful order, the median cannot be defined for this type of variable.
Since the median is mostly calculated, it cannot be defined for even-numbered sets of ordinal data. When the dataset is odd-numbered, however, it is possible since the middle value can simply be counted.
For discrete and continuous data, the median can always be found or calculated, since the values are numerical and can be used in the mathematical operations needed to determine this measure of central tendency.
- ✓ 3D live preview of your individual configuration
- ✓ Free express delivery for every single purchase
- ✓ Top-notch bindings with customised embossing

FAQs
The median is the middle number or value of a dataset. It is further defined as the 0.5 quantile or the second quartile, meaning that it splits a dataset in the exact half of its numbers.
While the median gives the middle value, the one where 50% of your values are lower than it. The nasty, on the other hand, presents the average of a dataset.
Median averages that rely on midpoints are good for establishing averages that do not take account of extremes at either end of the scale. In short, they tend to ignore outlier statistics.
