In statistics, researchers classify data into several levels, and the first level is nominal data. Nominal data, one of the fundamental levels of measurement in research, categorizes variables without implying order or numerical value. This type of data provides the basis for qualitative analysis, allowing researchers to group, differentiate, and understand the characteristics of a given set. We will cover nominal data in-depth in this guide.
Definition: Nominal Data
In statistics, this is a form of data that labels responses without offering any quantitative information. The labels can be divided into distinct groups that are mutually exclusive. As an example, gender would fall under nominal data, as this data cannot be measured or ordered. It is also contrasted with interval and ratio data in that you can’t use mathematical operators on it. This type of data helps researchers determine the form of analysis that can be done, as well as the conclusions that can be drawn.
Nominal data – Levels of measurement
In statistics, there are several levels of measurement, and nominal data is the lowest level as it provides the least amount of detail. It can be categorized but lacks meaningful order or rank, equal spacing between values, and a natural zero value. Ordinal data is considered the next level of measurement, and ratio and interval offer the highest amount of detail. It has a meaningful order or rank.
Interval data can be categorized, ranked, and evenly spaced, but it lacks a true zero. For example, the difference between two temperatures is a type of interval data. Ratio data is similar to interval data, except for the fact that it has a natural zero. An example of ratio data is the temperature in Kelvin.
Nominal data – Examples
We can express this data in either words or numbers, and each variable will fit into a single category. For example, an individual can either be employed or unemployed. Variables that can only be placed in two categories are known as binary or dichotomous data.
While this form of data can sometimes be presented in numbers, you will still not be able to conduct any meaningful mathematical operations with the information. Let’s look at some variables and their respective categories.
| Variable | Responses |
| Address | 20100, 3209, 4096 |
| Political leaning | Progressive, conservative |
| Nationality | American, British, French, German |
| Eye colour | Blue, brown, amber, grey, green, hazel, red |
Nominal data – Collection
Researchers can collect this type of data using surveys and questionnaires, and in this case, they can use either open-ended or closed-ended questions. Closed-ended questions have few responses, all of which are outlined by the researcher. Such surveys would be ideal in cases where the possible responses are limited.
A good example would be a situation where a researcher needs to find out whether the respondent is employed. In this case, they can simply list the possible answers as either yes or no. You can use open-ended questions when there are very many possible responses. Here are some examples of open-ended survey questions:
- What’s your national ID number?
- What’s your favorite animal?
- Which genre of music do you like?
Nominal data – Analysis
To visualize this type of data, you can use tables and charts. It is essential to use descriptive statistics to make some sense of the data provided. With this information, you can find the central tendency and frequency distribution of the collected data. You should note that mode is the only measure of central tendency that you can use on this form of data. Mean would require you to perform mathematical operations, while median would require you to arrange the numbers in ascending or descending order.
Distribution
To view the distribution of the data, you should draw up a percentage frequency distribution table or a simple frequency distribution table. Let’s look at these two options.
Simple frequency distribution
When creating a simple frequency distribution table, you have to list the variables on the left side. On the right side, you should list the number of variables that fall into that category. Look at the example below to understand how these tables work.
| Political preference | Frequency |
| Democrats | 25 |
| Republicans | 20 |
| Independent | 5 |
Percentage frequency distribution
You can create a percentage frequency distribution table by converting the numbers in the above table into percentages. To do this, you have to take the number in one category and divide it by the number of respondents. You can then multiply the product by 100. Here is a sample of a percentage frequency distribution table:
| Political preference | Percent |
| Democrats | 50% |
| Republicans | 40% |
| Independent | 10% |
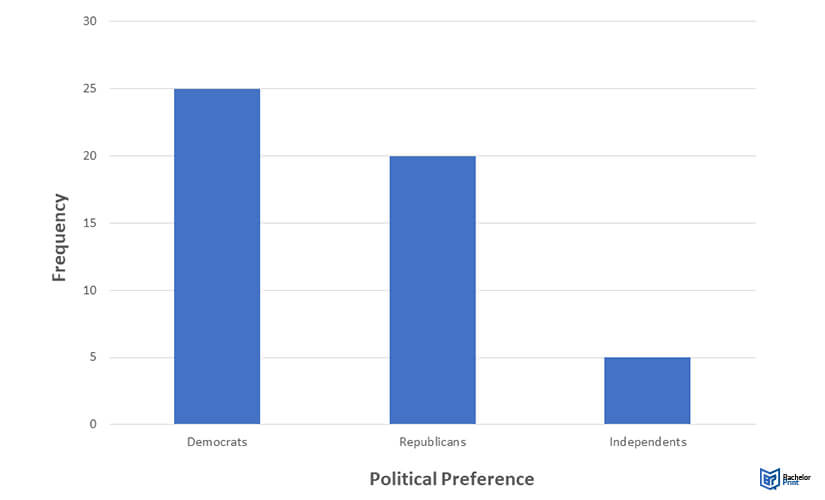
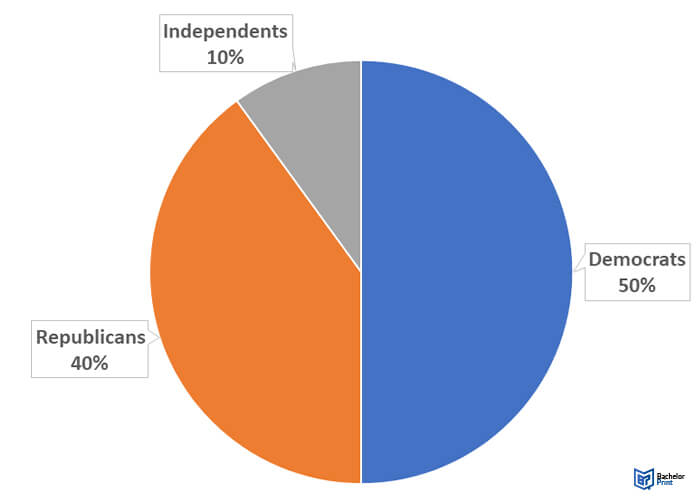
Once you create the tables, you can use the information to develop bar graphs and pie charts. These are essential for visualizing the data.
Bar graph
When developing bar graphs, you will have to use the frequency distribution table. In this case, the x-axis would represent the categories, and the y-axis would represent the frequency.

Pie graph
To create a pie chart, you have to use data from the percentage frequency distribution table. The sizes of the slices should be proportional to the percentages. For instance, if a majority of people identified as Democrats in the study, this category should take up a larger chunk of the pie chart.

Central tendency
Central tendency is a way of finding the middle of a data set. In statistics, the central tendency is measured using mean, mode, and median. However, when working with nominal data, you will have to use mode as the other two would be inapplicable. When finding the mode in a data set, you should identify the label that is appearing more frequently. In our example above, the mode would be ‘Democrats’ as this is the most recurring.
Statistical tests for nominal data
You can use statistical tests to evaluate nominal data. Read on to learn how these tests are applied.
Inferential statistics
Inferential statistics allow researchers to make predictions about the whole population, and they can help to test hypotheses. When working with nominal data, you will have to use non-parametrical statistical tests as these don’t assume a normal distribution of variables. Parametrical statistical tests assume an order to the variables.
Chi-square tests
Chi-square tests are non-parametrical statistical tests that will help you evaluate nominal data. If a data set only has one variable, you can use the chi-square goodness of fit test. On the other hand, data sets that have two variables can be analyzed with the chi-square test of independence.
You can use the chi-square goodness of fit test when the data is collected from one group using random sampling. With this test, the researcher can find out if the frequency distribution of the sample matches the expectations of the greater population.
The chi-square test of independence will help you find out if the relationship between two variables is significant.
- ✓ Free express delivery
- ✓ Individual embossing
- ✓ Selection of high-quality bindings
FAQs
This is data that can be classified based on qualitative characteristics, and it doesn’t have a quantitative aspect. It can be labelled in mutually exclusive categories.
Nominal data differs from ordinal data since it lacks a natural order or rank. It can also be distinguished from interval and ratio data in that researchers cannot conduct mathematical operations on it.
When evaluating nominal data, you have to organize and visualize the information using tables and charts. You can analyze it with statistical methods such as hypothesis testing.
You can only find the mode when working with nominal data. The other measures of central tendency cannot be applied to this type of data.
